1
$\begingroup$

I want to fit data in the hope of obtaining an estimate for other data points (i.e. a good guess for the last 4 variables as a function of the first).

Example data:

data={{3.38, 1.028877662, 2.009398505, 2.067322478, 4.214191194}, {3.4, 
  1.030082372, 1.995543604, 2.105894366, 4.234656059}, {3.5, 
  1.035994874, 1.992385102, 2.200815333, 4.282937808}, {3.57, 
  1.036731784, 1.986961442, 2.224357922, 4.307824219}, {3.6, 
  1.036978228, 1.985081926, 2.231988058, 4.315914728}, {3.62, 
  1.037229736, 1.983076125, 2.239730469, 4.323988127}, {3.78, 
  1.038461995, 1.969909372, 2.283628754, 4.374960036}, {3.8, 
  1.038741973, 1.96716995, 2.291334094, 4.384253554}}

This data was obtained using a computationally expensive method. I want to obtain good guesses for more data points located in between (interpolation) and slightly outside this region (extrapolation). This guess will then be used in the same computationally expensive method were a better initial guess results in a cheaper computation of the exact answer for these additional points.

Thus, I am seeking for a fit that will hopefully be predictive in the current data range and slightly outside it.

There is no general expectation for the shape of the functions except that the function is expected to be continuous and monotonic (increasing or decreasing) (and probably once differentiable).

(The data is exact so ideally the fit goes exactly through the provided data points. Also I do not care about accuracy for points say further than 0.2 away from current data points. The purpose is not to guess the true underlying function which will no doubt be too complicated and not even well defined for all real values.)


I tried using NetChain which was not producing amazing results (probably due to my ignorance in how to use it). I had expected that as I added layers it would eventually at least overfit and go through the data points but in fact I couldn't produce any fit at all that actually went through the data points. (Of course this approach does not use the monotonicity constraint and something else might be better.)


Here are example fits that I would consider a decent fit (although the first function is not monotonic and would be a slightly better fit if it were):

enter image description here

These were obtained by fitting polynomials of order 7 and adding points at the end to get a better asymptotic behavior. I would be very happy if I could reproduce a similar fit without having to fine tune the polynomial order. (The asymptotic behavior is not actually important I only care about points a distance less than 0.2 away from current data points, so I guess I did that mostly for aesthetic reasons.)


P.S. The data as posted here is obviously only accurate to at most 9 digits but that is just the truncation I used here to keep the post readable. I don't think the error introduced by this rounding will pose any problem to finding a fit but if for some method it does I can provide the high precision data


Also I used the word fit in the title but perhaps interpolation (and slight extrapolation) are more accurate. The resulting function should pass through the data points (or very close to them).


Context:

The first parameter defining a family of non-convex optimization problems. The other parameters are parameters within that non-convex optimization problem over which an objective is optimized. The point in parameter space (i.e. the last 4 variables), give the point that minimizes the last parameter under the constraint that some objective function is positive.

Monotonicity in the last variable (as a function of the first) is mathematically guaranteed. Monotonicity in the other variables is simply observed.

$\endgroup$
17
  • 1
    $\begingroup$ I guess I don't understand how you can guess FOUR variables as a function of ONE if you don't have a functional form in mind. Wouldn't you have an infinite number of possibilities? $\endgroup$
    – MarcoB
    Commented Jul 20, 2023 at 19:17
  • $\begingroup$ I don't see how the four variables as a function of one is important. You can see it as 4 independent fits if you want. Of course I agree that there is an infinite space of possible functions going through these points. I'm hoping to somehow get one that is predictive. This might mathematically be difficult but the human mind is quite good at it. (Just drawing a nice looking curve between these points. I believe that given enough points neural networks are also often quite good at it although perhaps only if there is more data available.) $\endgroup$
    – Kvothe
    Commented Jul 20, 2023 at 19:24
  • 1
    $\begingroup$ Including a plot of the 4 pairs of data would be helpful. $\endgroup$
    – JimB
    Commented Jul 20, 2023 at 20:01
  • 2
    $\begingroup$ This issue is your unrealistic expectations about what kind of fit is possible just given the data. As such you should seek statistical help rather than Mathematica help. You've just got 8 data points per regression and even if one could assume that the predictor variable is without error, all 4 response variables are highly correlated with each other. In short, a more complex error structure is indicated. But, again, with only 8 data points for each regression, one is severely restricted as to what is possible and reasonable. $\endgroup$
    – JimB
    Commented Jul 31, 2023 at 21:02
  • 1
    $\begingroup$ I'm not trying to be facetious (although I suspect it will still look that way) but because you now use the phrase "perhaps interpolation (and slight extrapolation)" and therefore cannot and should not ascribe any justification to a statistical or automated procedure and need a data manipulation exercise, just draw the curves by hand that meets what you know about the data generation process. Clearly you believe (and I'm not saying you're wrong) that you have subject matter knowledge that knows when the "fit" is adequate. $\endgroup$
    – JimB
    Commented Aug 1, 2023 at 17:01

1 Answer 1

4
$\begingroup$
$Version

(* "13.3.0 for Mac OS X ARM (64-bit) (June 3, 2023)" *)

Clear["Global`*"]

data = {{3.38, 1.028877662, 2.009398505, 2.067322478, 
    4.214191194}, {3.4, 1.030082372, 1.995543604, 2.105894366, 
    4.234656059}, {3.5, 1.035994874, 1.992385102, 2.200815333, 
    4.282937808}, {3.57, 1.036731784, 1.986961442, 2.224357922, 
    4.307824219}, {3.6, 1.036978228, 1.985081926, 2.231988058, 
    4.315914728}, {3.62, 1.037229736, 1.983076125, 2.239730469, 
    4.323988127}, {3.78, 1.038461995, 1.969909372, 2.283628754, 
    4.374960036}, {3.8, 1.038741973, 1.96716995, 2.291334094, 
    4.384253554}};

xdata = data[[All, 1]];

plotData = Transpose[{xdata, #}] & /@ Transpose[data[[All, 2 ;;]]];

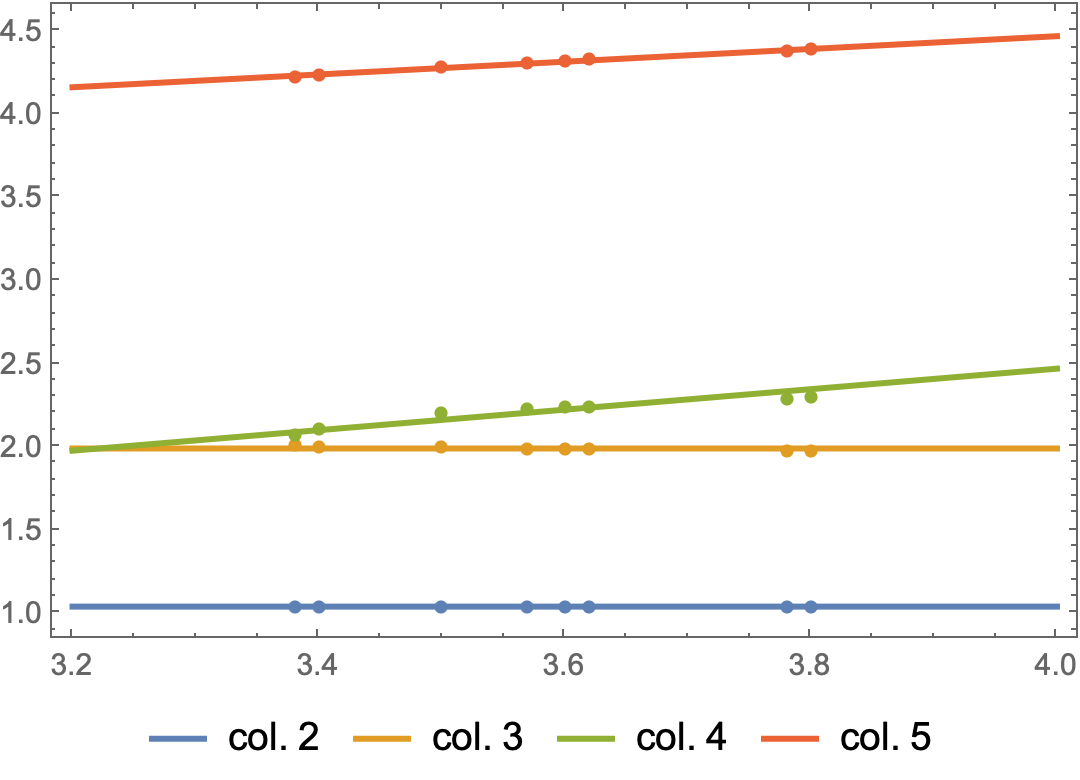
funcs = FindFormula[#, x, SpecificityGoal -> 1] & /@ plotData

(* {1.03539, 1.98619, 0.616559 x, 2.93046 + 0.383771 x} *)

Show[
 Plot[Evaluate[Tooltip /@ funcs], {x, 3.2, 4},
  PlotLegends -> Placed[
    LineLegend[StringForm["col. ``", #] & /@ Range[2, 5],
     LegendLayout -> "Row"],
    Below]],
 ListPlot[plotData],
 Frame -> True]

enter image description here

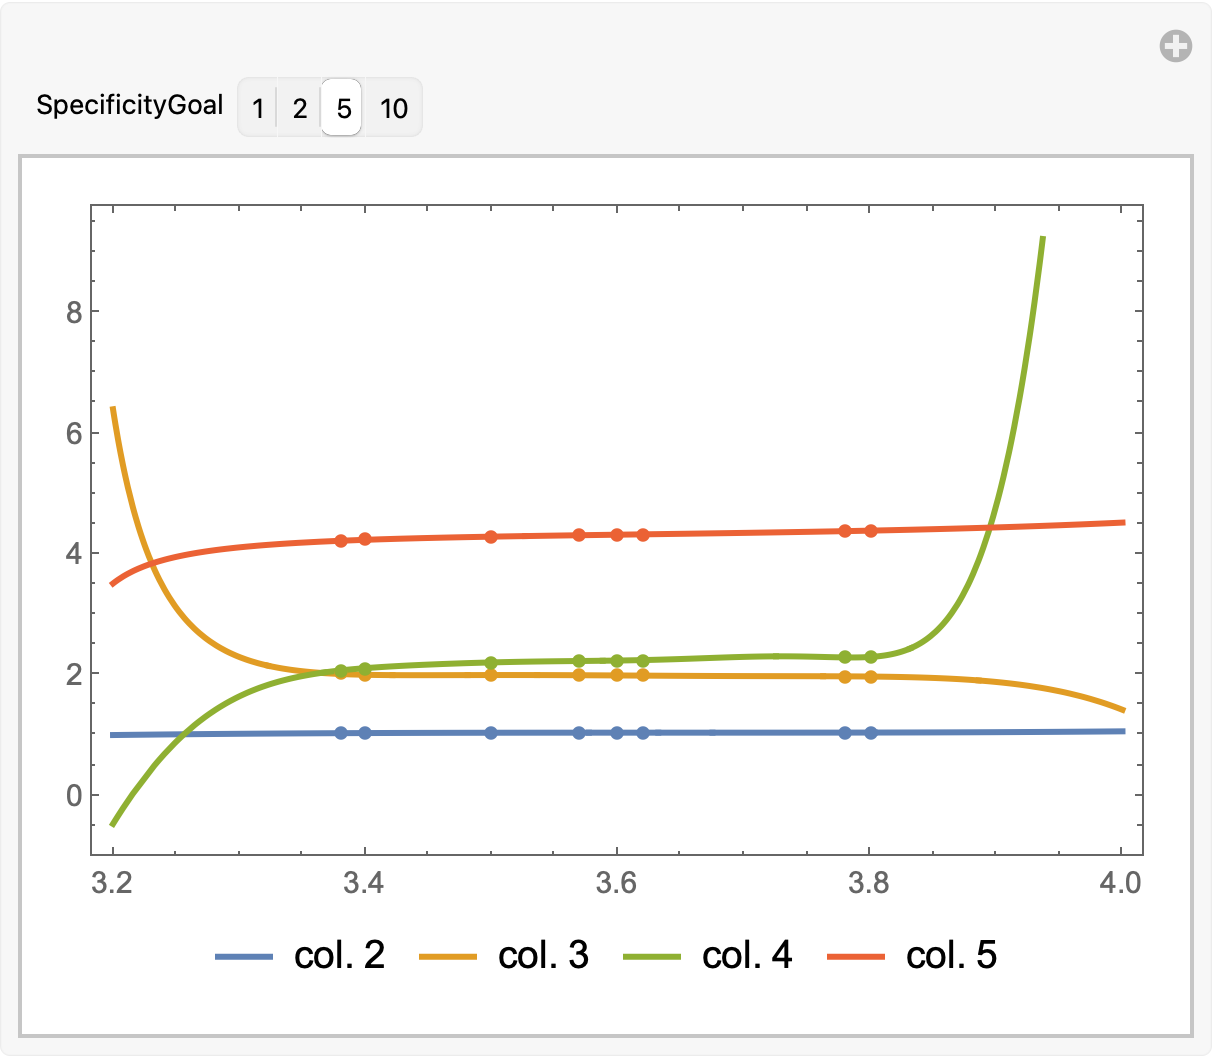
EDIT: If you want a "better" fit increase the SpecificityGoal; however you may be overfitting the data, particularly since there are so few data points.

Manipulate[
 funcs = FindFormula[#, x, SpecificityGoal -> spec] & /@ plotData;
 Show[
  Plot[
   Evaluate[Tooltip /@ funcs], {x, 3.2, 4},
   PlotLegends -> Placed[
     LineLegend[StringForm["col. ``", #] & /@ Range[2, 5],
      LegendLayout -> "Row"], Below]],
  ListPlot[plotData], Frame -> True],
 {{spec, 1, "SpecificityGoal"}, {1, 2, 5, 10}},
 SynchronousUpdating -> False,
 TrackedSymbols :> {spec}]

enter image description here

$\endgroup$
3
  • $\begingroup$ Thanks for the suggestion. Unfortunately these fits are terrible. They are basically constant or linear and most don't even come close to even just a few points. This can be seen easily if you shift the different components to lie close together (add the line data=(# - {0, 0, 1, 1.2, 3.25}) & /@data for example to see this. $\endgroup$
    – Kvothe
    Commented Jul 31, 2023 at 16:06
  • $\begingroup$ Thanks this now works much better with the higher SpecificityGoal. I would still hope to get an answer that uses the monotonicity of the data but this gives a quick decent fit. $\endgroup$
    – Kvothe
    Commented Jul 31, 2023 at 17:46
  • 1
    $\begingroup$ The fits certainly reproduce the data (especially with spec = 5 but that requires the estimation of 4, 2, 5, and 4 coefficients for the regressions, respectively. Despite the OP's claim that the observations are exact, 4 or 5 coefficients for just 8 data points is extreme at best. (Using spec = 10 for one of the regressions ends up with 9 coefficients!) As mentioned in my comment above, the OP's expectations are not realistic. But your answer with spec = 1 is good and the best that one can do. $\endgroup$
    – JimB
    Commented Jul 31, 2023 at 21:10

Your Answer

By clicking “Post Your Answer”, you agree to our terms of service and acknowledge you have read our privacy policy.

Not the answer you're looking for? Browse other questions tagged or ask your own question.