1
$\begingroup$

I have a table:

lengthvstemp={
  {3.15449,1.46395*10^-7}, 
  {0.623364,1.35011*10^-7},
  {0.250102,1.22539*10^-7},
  {0.124968, 9.6637*10^-8}, 
  {0.100013,.47764*10^-8}
 };

When I make ListLogLogPlot:

ListLogLogPlot[lengthvstemp]

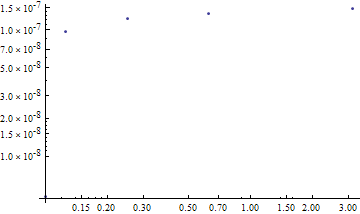
It gives me a plot like this:
enter image description here

Apparently the y axis is not on log scale. Has any one had the same issue or known what's going on?

$\endgroup$
2
  • $\begingroup$ John, the plot you showed is not what I obtain when trying to plot your data. Try adding PlotRange -> All to your plot and see if that improves your situation. $\endgroup$
    – MarcoB
    Commented Jun 3, 2015 at 22:54
  • $\begingroup$ yeah, that's an good idea, but not working for me. Maybe it's because of the version problem as Verbeia♦ said. $\endgroup$ Commented Jun 3, 2015 at 23:23

1 Answer 1

1
$\begingroup$

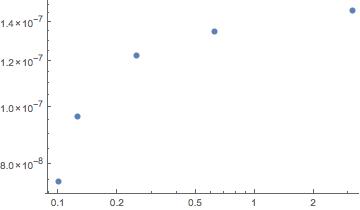
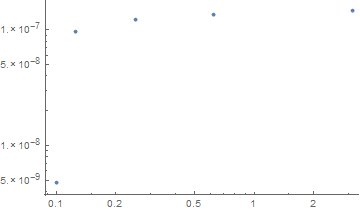
This actually is a log scale on the vertical axis, if you look carefully. The major tick marks get a little closer together as the values increase, but it is a subtle difference.

However your data set seems to have tripped some differences in the way version 10 handles automatic plot ranges and tickmarks, relative to version 9.

This is what I get in version 10.1.

enter image description here

Here is the same data and commands in version 9.0.1

enter image description here

Both are from fresh sessions. For reasons I don't yet understand, my two Mathematicas are interpreting PlotRange -> Automatic as PlotRange -> Full, but yours isn't.

$\endgroup$
5
  • $\begingroup$ Thanks. This looks good. But I have tried PlotRange -> Automatic / All / Full , and they all give the same result. I have Mathematica version 10.0, I am trying to update it to 10.1. $\endgroup$ Commented Jun 3, 2015 at 23:21
  • $\begingroup$ That is strange. Are you sure your data is what you posted here? $\endgroup$
    – Verbeia
    Commented Jun 3, 2015 at 23:21
  • $\begingroup$ I found something interesting. The graph I posted in the question is the plotting in a ".m" package. I just evaluated it in notebook, it gives me the same result as you posted for version 10.1. So if I work in a package it still can't plot it right. Any idea? $\endgroup$ Commented Jun 3, 2015 at 23:29
  • $\begingroup$ @Johneyishere Both in version 8.0.4 and 10.1 (under Win7) your code works correctly for me even if I import it from a package. $\endgroup$ Commented Jun 4, 2015 at 0:01
  • $\begingroup$ So problem solved. In the package evaluation to get the desired result, I have to specify the plot range on y axis. $\endgroup$ Commented Jun 4, 2015 at 1:43

Your Answer

By clicking “Post Your Answer”, you agree to our terms of service and acknowledge you have read our privacy policy.

Not the answer you're looking for? Browse other questions tagged or ask your own question.