added 64 characters in body
Source Link
MarcoB
  • 67.7k
  • 18
  • 96
  • 198

I have a table:

lengthvstemp={{3.15449,1.4639510^-7},{0.623364,1.3501110^-7},0.250102,1.2253910^-7}, {0.124968, 9.663710^-8}, {0.100013,.47764*10^-8}};

lengthvstemp={
  {3.15449,1.46395*10^-7}, 
  {0.623364,1.35011*10^-7},
  {0.250102,1.22539*10^-7},
  {0.124968, 9.6637*10^-8}, 
  {0.100013,.47764*10^-8}
 };

When I make ListLogLogPlotListLogLogPlot: ListLogLogPlot[lengthvstemp]

ListLogLogPlot[lengthvstemp]

It gives me a plot like this:
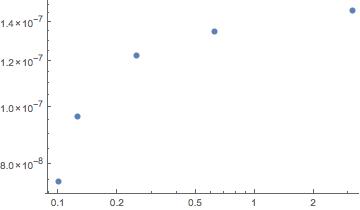
enter image description here

Apparently the y axis is not on log scale. Has any one had the same issue or known what's going on?

I have a table:

lengthvstemp={{3.15449,1.4639510^-7},{0.623364,1.3501110^-7},0.250102,1.2253910^-7}, {0.124968, 9.663710^-8}, {0.100013,.47764*10^-8}};

When I make ListLogLogPlot: ListLogLogPlot[lengthvstemp]

It gives me a plot like this:

enter image description here

Apparently the y axis is not on log scale. Has any one had the same issue or known what's going on?

I have a table:

lengthvstemp={
  {3.15449,1.46395*10^-7}, 
  {0.623364,1.35011*10^-7},
  {0.250102,1.22539*10^-7},
  {0.124968, 9.6637*10^-8}, 
  {0.100013,.47764*10^-8}
 };

When I make ListLogLogPlot:

ListLogLogPlot[lengthvstemp]

It gives me a plot like this:

enter image description here

Apparently the y axis is not on log scale. Has any one had the same issue or known what's going on?

Source Link

ListlogLogPlot can't work on y axis

I have a table:

lengthvstemp={{3.15449,1.4639510^-7},{0.623364,1.3501110^-7},0.250102,1.2253910^-7}, {0.124968, 9.663710^-8}, {0.100013,.47764*10^-8}};

When I make ListLogLogPlot: ListLogLogPlot[lengthvstemp]

It gives me a plot like this:

enter image description here

Apparently the y axis is not on log scale. Has any one had the same issue or known what's going on?