0
$\begingroup$

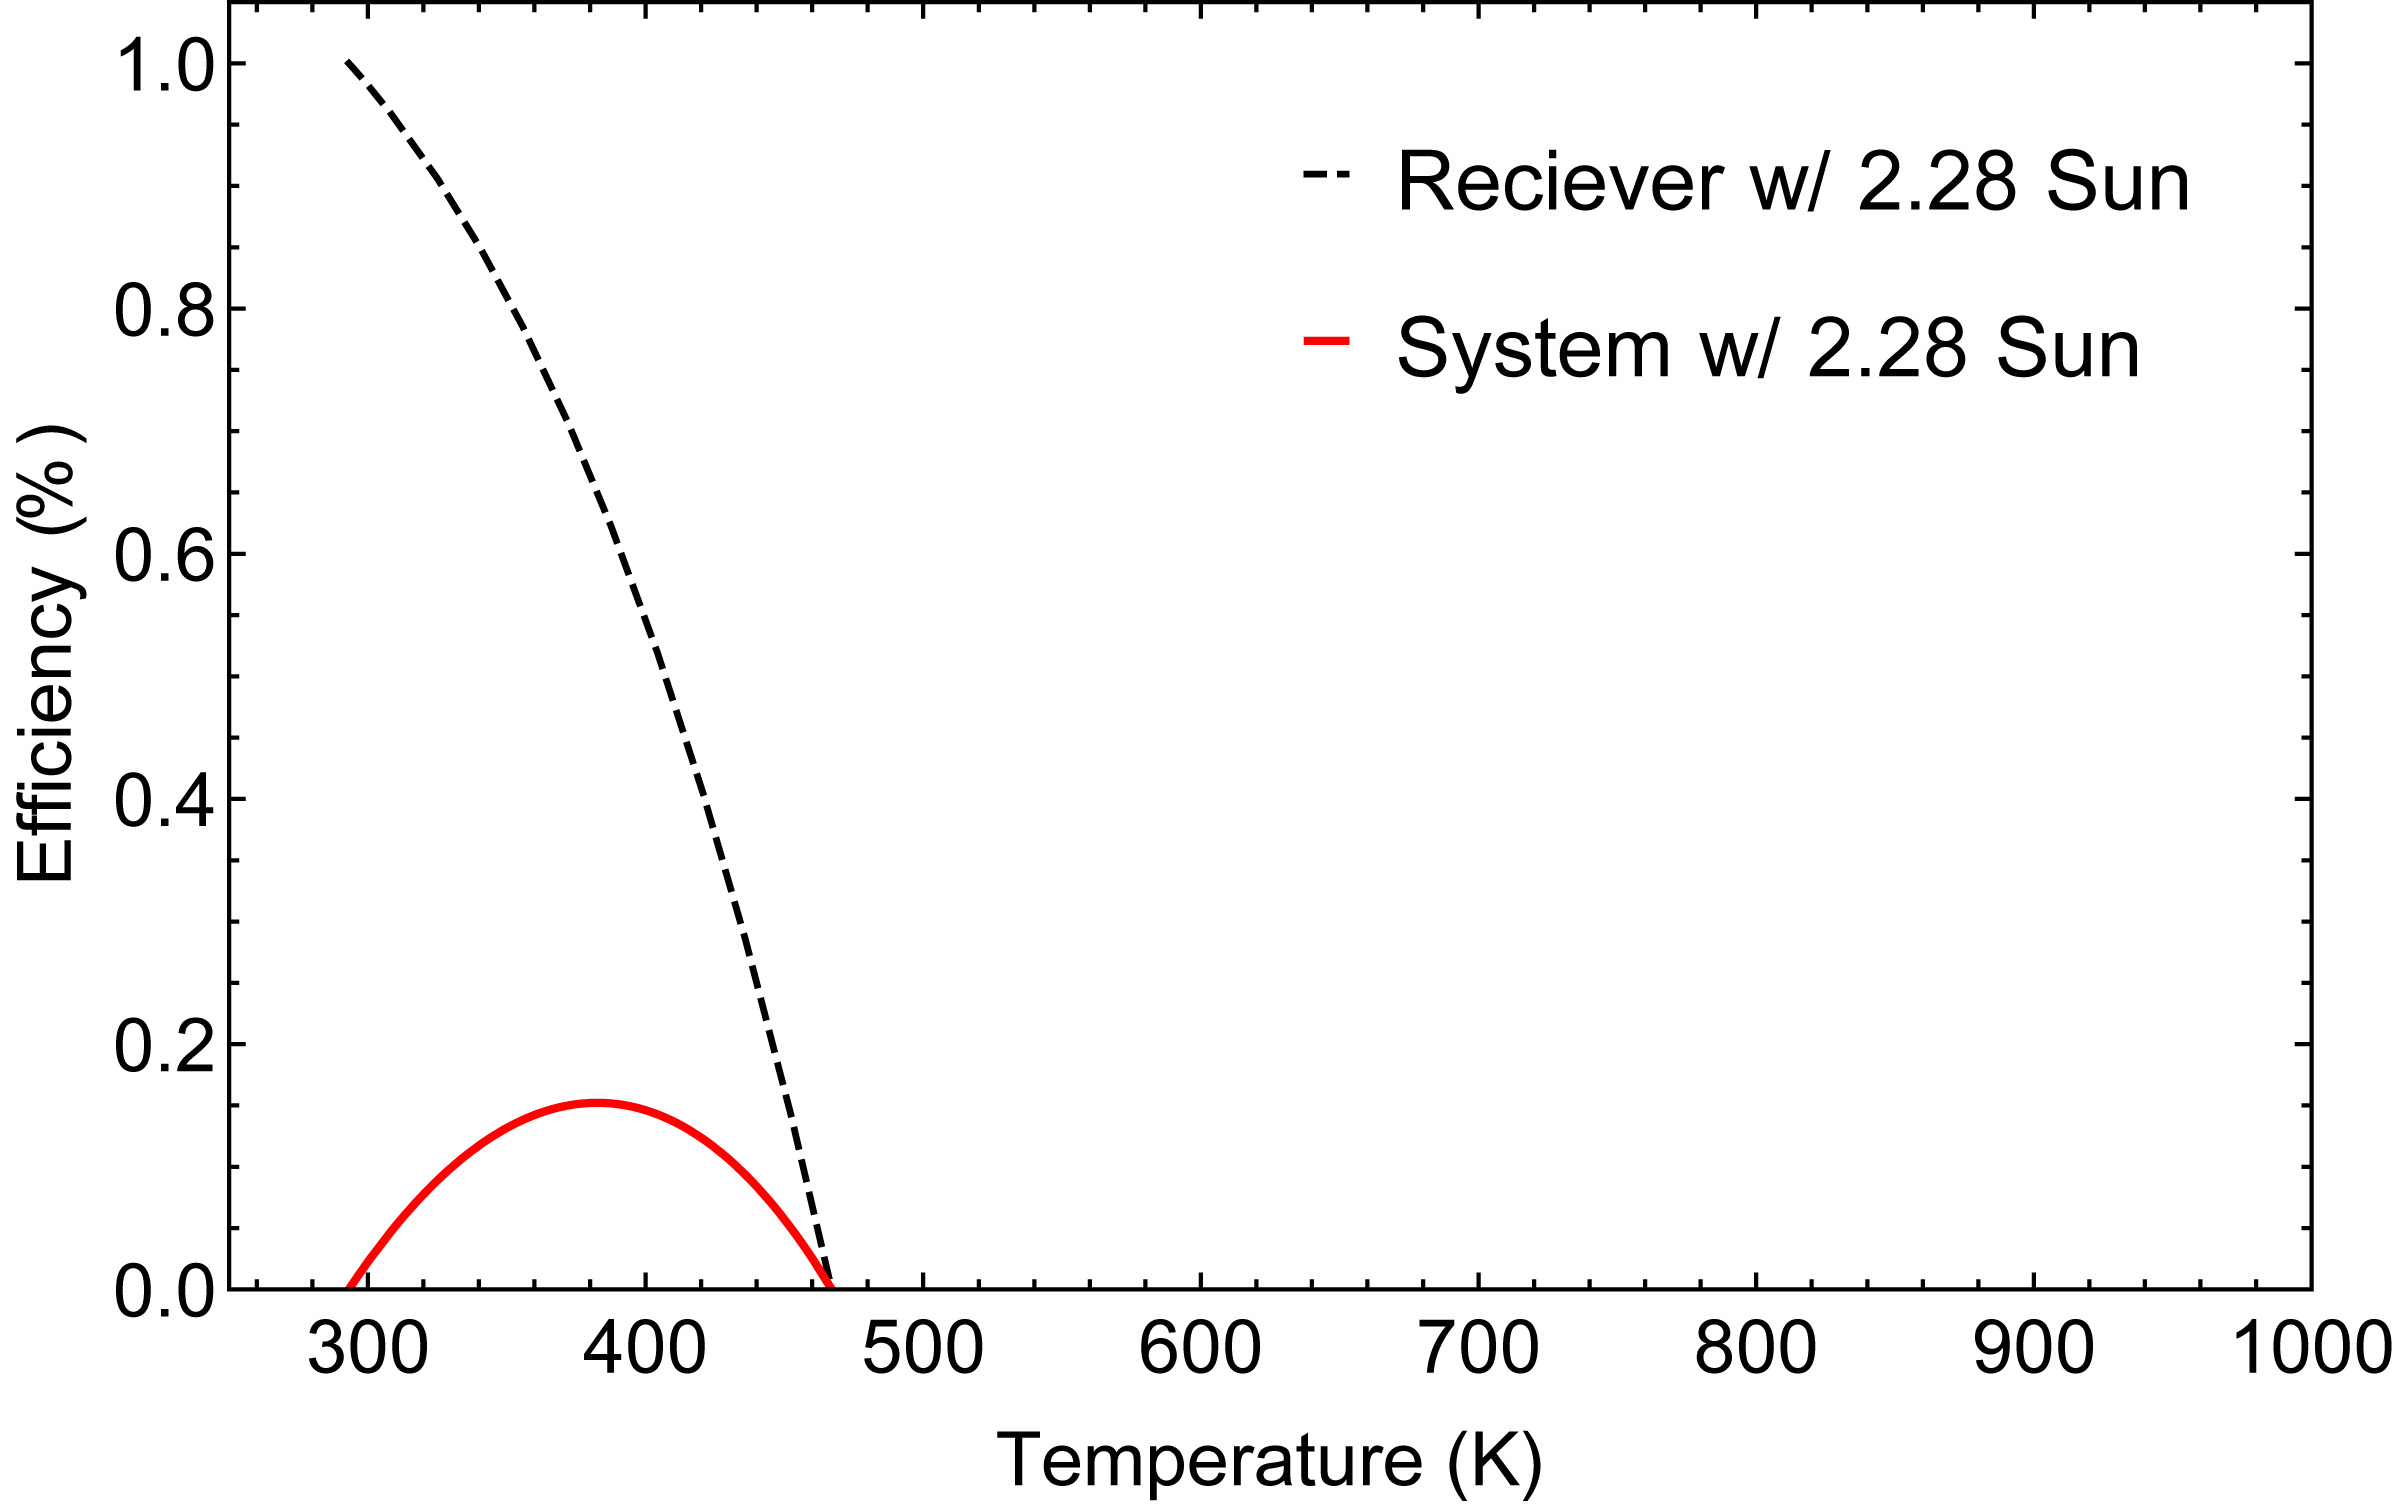
It looks simple, but I'm been trying to solve this issue for days, but no luck yet. So, here I used LinTicks, as customized option and another graphic option.

Here is my code. I'm always trying to make it simple, but this thing gets heavier with a graphic option (autoLegend). If you know better way, please, let me know.

Please, find more information about autoLegend here. In addition, you can find CustomTicks here, which I had to run the package before running my code.

ClearAll["Global`*"]

(autoLegend inserted here)

σ = 5.67*^-8;(*Stefan-Boltzmann Constant*)
ϵ = 1;(*Emissivity*)
α = 1;(*Absorbtivity*)
τ = 1;(*Transmittance*)
g = 1*^3;(*Solar radiation 1Kw/m^2" *)
c = 2.28;(*Concentration*)
receff[x_] := α τ - (σ ϵ (x^4 - 293.15^4))/(c g);
syseff[x_] := (α τ - (σ ϵ (x^4 - 293.15^4))/(c g)) (1 - 293.15/x);
without = 
  Plot[Evaluate[{receff[x], syseff[x]}], {x, 293.15, 1073.15}, 
    PlotStyle -> (Directive @@@ 
      Transpose[{Join[ConstantArray[Dashed, 1], 
         ConstantArray[Thick, 1]], 
        Flatten[ConstantArray[{Black, Red}, 1]]}]), Frame -> True, 
   PlotRange -> {{250, 1000}, {0, 1.05}}, 
   FrameLabel -> {"Temperature (K)", "Efficiency (%)"}, 
   FrameStyle -> Directive[Black, 18], 
   FrameTicks -> {LinTicks[0, 1100, 200, 5], LinTicks[0, 1, 0.4, 5], None, None}, 
   ImageSize -> Large];

autoLegend[
 Show[without], {"Reciever w/ 2.28 Sun", "System w/ 2.28 Sun"}, 
 Background -> Directive[None, Opacity[.5]], Alignment -> {0.43, 0.8}]

I was able to make big text for Ticks, but I couldn't get Legend big. I used Lintick to keep Ticks with high resolution image. When I enlarge an image without LinTicks, I lost Ticks. That's why I used LinTicks. But if you guys know to get around this, please, let me know too. Because I have to run the LinTicks package every time before I run this code to work.

If you know how to make it big, please, help me. It would be very appreciable. Thank you.


Here was what I got. As you can see, ticks are big as I wish, but I wasn't able to control the size of legend.
enter image description here

$\endgroup$
10
  • $\begingroup$ Please try to provide a shorter piece of code that illustrates the essence of your question. $\endgroup$
    – bbgodfrey
    Commented Apr 28, 2015 at 3:22
  • $\begingroup$ So you're obviously using the code from my answer here. You shouldn't post such things without a link. Also, you're apparently using LevelScheme. It will make it almost impossible for people to reconstruct what you're doing if you don't cite your sources. But I still don't understand the question. Do you have a problem that occurs only when using autoLegend with LinTicks? What version of Mathematica are you using? $\endgroup$
    – Jens
    Commented Apr 28, 2015 at 3:38
  • $\begingroup$ You can probably just add the option BaseStyle -> Larger to the autoLegend call. There is more information on controlling the dimensions of the legend in my linked post. $\endgroup$
    – Jens
    Commented Apr 28, 2015 at 3:44
  • $\begingroup$ This link will hopefully tell you directly what to do: Font size in PlotLegends, using Table to generate the list in the legend. I guess you want autoLegend[Show[without],{"Reciever w/ 2.28 Sun","System w/ 2.28 Sun"},Background->Directive[None,Opacity[.5]],Alignment->{0.3,0.8},BaseStyle->{FontSize->18}] $\endgroup$
    – Jens
    Commented Apr 28, 2015 at 3:53
  • 4
    $\begingroup$ I'm voting to close this question as off-topic because the problem in the final form stated in the comment cannot be reproduced in versions 8 or 10 with LevelScheme installed and autoLegend used as suggested in the comments and linked answer. $\endgroup$
    – Jens
    Commented Apr 28, 2015 at 5:39

2 Answers 2

2
$\begingroup$

My main suggestion would be to use existing legending functionality in version 9+, e.g. LineLegend rather than hack things together from scratch like this.

I think the main issue with your code and the reason it does not work, is that you are not actually providing any means for text-formatting options to affect your labels. The relevant piece of code in legendMaker is

Text[#3, FormatType -> TraditionalForm]

You should change this to something like

Style[Text[#3, FormatType -> TraditionalForm], FilterRules[opts, Style]]

You then need to make the functions actually accept and pass the options to Style. The way you are using OptionsPattern, this won't work currently. As the documentation says,

OptionsPattern[] uses the default options of the nearest enclosing function.

So an option that is not explicitly defined for autoLegend or makeLegend won't get passed down. The way around that is to change the function definition from

legendMaker[textLabels_, opts : OptionsPattern[]]

to

legendMaker[textLabels_, opts : OptionsPattern[{legendMaker, Style}]]

And similarly for autoLegend.

I won't fix up the code for you completely because I honestly think that you should base your autoLegend function on the existing built-in legending functionality. You could then just use LabelStyle to style your text.

$\endgroup$
3
  • $\begingroup$ Hi Verbeia, thank you so much for your comments. I just started run Mathmatica and am trying to run hard, but it is not easy at all. After picking up very basic, I started worked on graphics, so I can use Mathematica for my real life, but yes, I don't have a sound understanding of Mathematica yet. Thank you so much for your advice. I will try. $\endgroup$
    – SungwooY
    Commented Apr 28, 2015 at 4:10
  • $\begingroup$ Glad I could help. If you are a beginner I would suggest trying to do simple things first, like using the built-in legending functionality instead of taking custom stuff from this site that was designed for an earlier version of the program. Since you mention in another comment that you are using version 9, none of this extra complexity is necessary. $\endgroup$
    – Verbeia
    Commented Apr 28, 2015 at 4:13
  • $\begingroup$ I totally agree. My rule of thumb is to write simple as much as I can, but I ended up like this messed codes. The reason I used LinTicks was that Ticks were disappeared after exporting the graph in high resolution as discussed here. [link] (mathematica.stackexchange.com/questions/51367/…) This is how I ended up with LinTicks. In addition, I thought autoLegend make my code simple, but I guess I was wrong. I will listen your advice. Thank you so much for your help. $\endgroup$
    – SungwooY
    Commented Apr 28, 2015 at 4:22
0
$\begingroup$

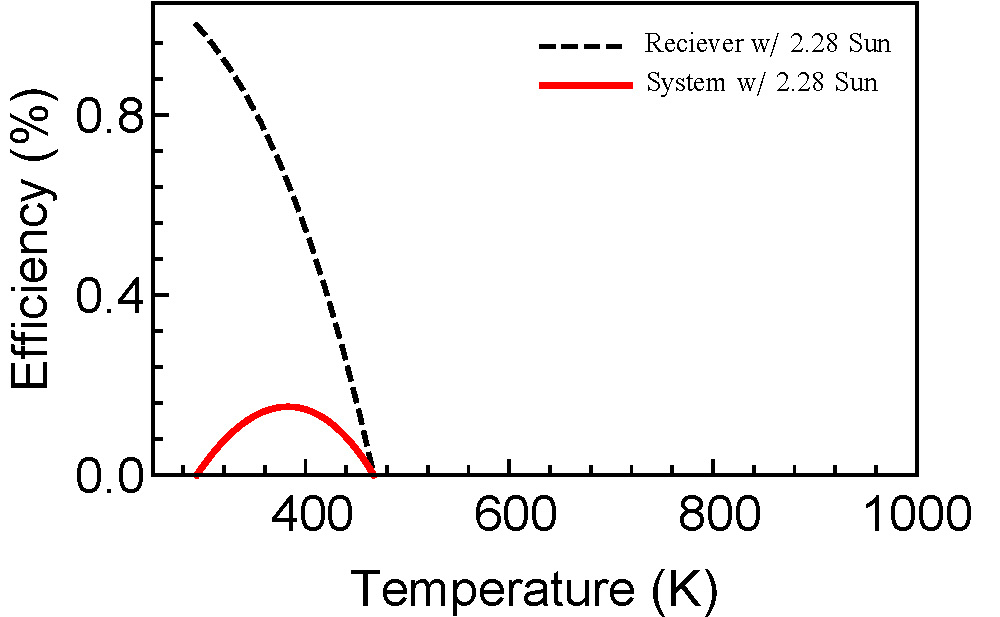
Following Verbeia's advice, I tried to use the existing functions built in Mathematica and tried to make simple as possible. I was able to slim down my code. It looks simpler and cleaner. Thank you Verbeia for your advice.

ClearAll["Global`*"]
σ = 5.67*^-8;(*Stefan-Boltzmann Constant*)
ϵ = 1;(*Emissivity*)
α = 1;(*Absorbtivity*)
τ = 1;(*Transmittance*)
g = 1*^3;(*Solar radiation 1Kw/m^2" *)
c = 2.28;(*Concentration*)
receff[x_] := α τ - (σ ϵ (x^4 - 
     293.15^4))/(c g);
syseff[x_] := (α τ - (σ ϵ (x^4 - 
        293.15^4))/(c g)) (1 - 293.15/x);
Plot[Evaluate[{receff[x], syseff[x]}], {x, 293.15, 1073.15}, 
 PlotStyle -> (Directive @@@ 
    Transpose[{Join[ConstantArray[Dashed, 1], 
       ConstantArray[Thick, 1]], 
      Flatten[ConstantArray[{Black, Red}, 1]]}]), Frame -> True, 
 PlotRange -> {{250, 1000}, {0, 1.05}}, 
 FrameLabel -> {"Temperature (K)", "Efficiency (%)"}, 
 FrameStyle -> Directive[Black, 18], FrameTicks -> Automatic, 
 ImageSize -> Large, 
 PlotLegends -> 
   Placed[LineLegend[{"Reciever w/ 2.28 Sun", "System w/ 2.28 Sun"}, 
     LegendMarkers -> Automatic, LegendMarkerSize -> {12, 24}, 
     LabelStyle -> 20], {0.73, 0.8}]]

enter image description here

$\endgroup$

Not the answer you're looking for? Browse other questions tagged or ask your own question.