I've noticed (in v11.0.1 and v10.3.1) a small problem with the graphic produced withPlot and the PlotLegends option: if you try to select manually the whole output graphic (mouse click) it won't include the legends ! It means you can't manually export the whole plot ("Save graphics as"), because you'll loose the legends ...
For example with this example taken from the docs:
Plot[{Sin[x], Sin[2 x], Sin[3 x]}, {x, 0, 2 Pi}, PlotLegends -> "Expressions"]
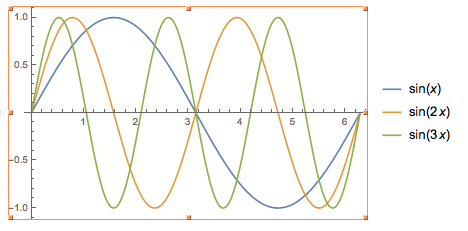
i get the following (orange) graphic frame if I click on the graphic curves (nothing happens if i click on the legends)
There is no way to include these legends.
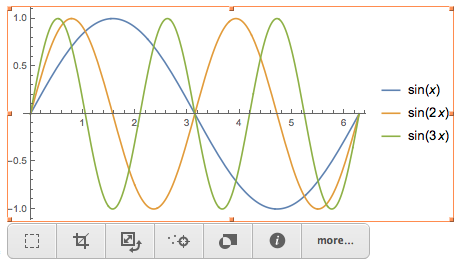
If you look at this same example in the docs (notebook not web) and select the graphic, it will include the legends because all the graphics where rasterized and are not anymore "native" plots (as indicated previously to me by @Michael E2).
I tried then to reproduce the doc "rasterized" graphic which actually has the Image type. It is interesting to see that the command:
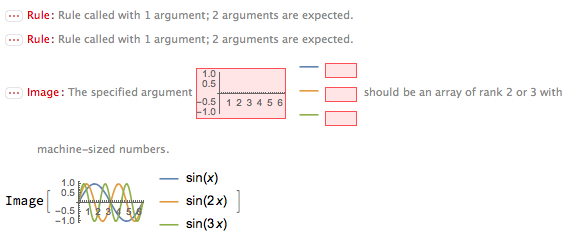
Plot[{Sin[x],Sin[2x],Sin[3x]}, {x,0,2Pi}, PlotLegends -> "Expressions"] // Image
produces an error (while other plots without PlotLegends won't):
The workaround here is to use Rasterize before Image (though Image should give directly the same result):
Plot[{Sin[x],Sin[2x],Sin[3x]}, {x,0,2Pi}, PlotLegends -> "Expressions"] //
Rasterize // Image
Once again, it is probably not a big problem as it concerns only the manual graphic export, but it looks clearly as a bug and there could be some other related (hidden) problems behind that ...


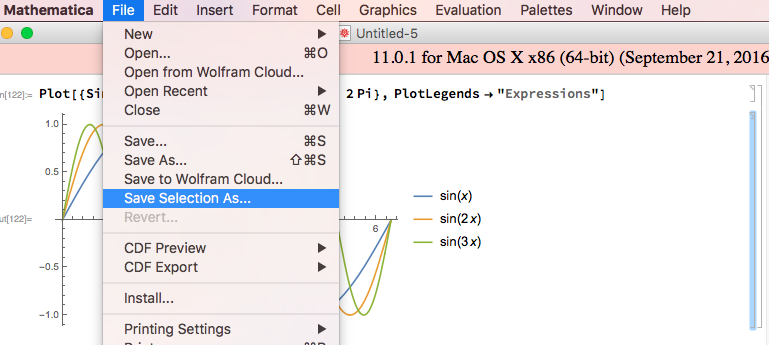
Plot[{Sin[x], Sin[2 x], Sin[3 x]}, {x, 0, 2 Pi}, PlotLegends -> "Expressions"], copy the output cell's contents (not the cell itself, but highlight the graph + the legend), paste it into an empty text cell (alt+7), and then save this cell by right clicking on the cell bracket and select Save Selection As. A bit cumbersome, but it likely scales better than the rasterized image, and prevents saving the cell label (the original Out[#]) $\endgroup$