3
$\begingroup$

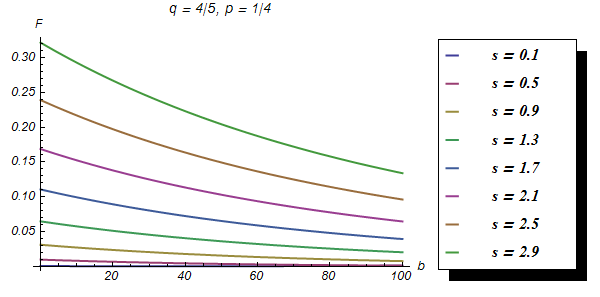
I am currently trying to get to graph with several functions as below. My problem is that I cannot change the font size in the legend (authomatically generated numbers by "Table" function). This code below is the best what I can get. Does anyone know how to insure that also automatically generated numbers have font size of 16 (or any).

Thanks!

<<PlotLegends`
Plot[
  Evaluate[(g (-1+q)^2 (a+b+g (1-q ) s)^2)/((a+b+g-g p q)^3) 
             /.{q->4/5,p->1/4,a->0.1,g->500,s->Range[0.1,3,0.4]}
  ],
  {b,0,100},
  AxesLabel->{b,F},
  PlotLabel->Style["q = 4/5, p = 1/4",FontSize->14],
  PlotStyle->Directive[Thick],
  PlotLegend->Table[Row[{Style["s = ",Bold,Italic,FontSize-> 16],i}],{i,0.1,3,0.4}],
  LabelStyle->Directive[Italic,FontFamily->"Helvetica",FontSize->12],
  LegendPosition->{0.5,-0.8}
]
$\endgroup$
3
  • $\begingroup$ If you have version 9 you should probably switch to the much better, built-in PlotLegends functionality. $\endgroup$ Commented May 7, 2013 at 18:12
  • $\begingroup$ Thank you for editing my code, I failed to do it properly... $\endgroup$
    – Kass
    Commented May 7, 2013 at 18:13
  • $\begingroup$ No, unfortunately I have Version 7... I saw that in 9 it is much more efficient... $\endgroup$
    – Kass
    Commented May 7, 2013 at 18:14

2 Answers 2

4
$\begingroup$

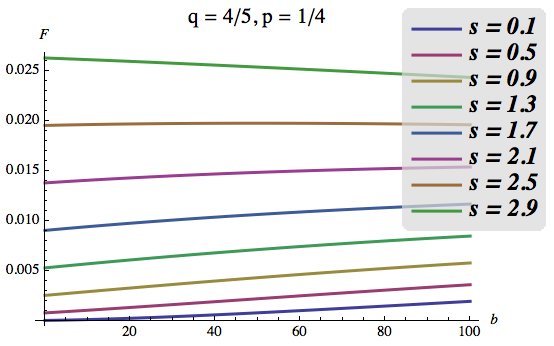
You could use Style[StringForm["s = ``", i], Bold, Italic, 16] to combine number and string (and quite a bit of PlotLegends parameter fumbling):

<< PlotLegends`
Plot[Evaluate[(g (-1 + q)^2 (a + b + g (1 - q) s)^2)/((a + b + g - g p q)^3) 
               /. {q -> 4/5, p -> 1/4, a -> 0.1, g -> 500, s -> Range[0.1, 3, 0.4]}
     ], 
 {b, 0, 100}, 
 AxesLabel -> {b, F}, 
 PlotLabel -> Style["q = 4/5, p = 1/4", FontSize -> 14], 
 PlotStyle -> Directive[Thick], 
 PlotLegend -> Table[Style[StringForm["s = ``", i], Bold, Italic, 16], {i, 0.1, 3, 0.4}],
 LabelStyle -> Directive[Italic, FontFamily -> "Helvetica", FontSize -> 12],
 LegendPosition -> {0.85, -0.55}, 
 LegendSize -> {0.6, 1.}, 
 ImageSize -> 600
]

enter image description here

$\endgroup$
2
  • $\begingroup$ Many thanks to both of you for your answers!! Both are extremely helpful. I will see which I will apply at the end as in fact I have several graphs (using "GraphicsGrid") but the same legend for all. But the hints you gave me provide already a lot of flexibility. Thanks again!! $\endgroup$
    – Kass
    Commented May 7, 2013 at 22:07
  • $\begingroup$ @Cactusenok If you like it an upvote and/or accept would be nice ;-) $\endgroup$ Commented May 7, 2013 at 22:11
2
$\begingroup$

In your legend, you can replace the line

Row[{Style["s = ",Bold,Italic,FontSize-> 16],i}]

by this:

 Row[{"s = ", i}, BaseStyle -> {Bold, Italic, FontSize -> 16}]

Here, I just used an option for Row to specify the style, because both elements of Row are intended to have the same style. Your statement had Style wrapping only the first element of the Row.

However, the formatting of PlotLegends is so incredibly bad that the newly increased size of the legend gets cut off.

Therefore, I would suggest instead to use my autoLegend function: copy the first code block in this answer and do this:

p = Plot[Evaluate[(g (-1 + q)^2 (a + b + g (1 - q) s)^2)/((a + b + g -
           g p q)^3) /. {q -> 4/5, p -> 1/4, a -> 0.1, g -> 500, 
      s -> Range[0.1, 3, 0.4]}], {b, 0, 100}, AxesLabel -> {b, F}, 
   PlotLabel -> Style["q = 4/5, p = 1/4", FontSize -> 14], 
   PlotStyle -> Directive[Thick]];

autoLegend[p, 
 Table[Row[{"s = ", i}, 
   BaseStyle -> {Bold, Italic, FontSize -> 16}], {i, 0.1, 3, 0.4}]]

autolegend

For more instructions on how to change the placement and format of the legend, see the linked post.

$\endgroup$

Your Answer

By clicking “Post Your Answer”, you agree to our terms of service and acknowledge you have read our privacy policy.

Not the answer you're looking for? Browse other questions tagged or ask your own question.