The following workaround can be seen as an alternative to simpler and more reliable (but in some situations not appropriate) workaround suggested by Jens. It is not perfect because in addition to being significantly more complicated it has several limitations due to abundance of bugs in Export-related functionality:
ImageSize must be specified in Export explicitly, it is not sufficient to provide it inside of Graphics expression
Scaled font size specification for tick mark labels must be provided via the FrameTicksStyle option in order to the default ImagePadding -> All behaving properly
The font size of PlotLabel must be absolute because specifying it as Scaled reveals a bug
I'm sure there also are other situations when handling of Scaled font size is broken and absolute font size must be specified
The distance between the tick mark labels and the frame gets smaller when you increase ImageSize and there is no proper way to control this distance
The following is a way to generate scalable tick marks and tick mark labels for all types of plots using only built-in (but undocumented) functions of version 10. Please note that it works correctly only for version 10 and already includes a fix for this bug (tested with versions 10.2 and 10.3.1):
data = Array[# &, 600];

linearFrameTicks = {
   {Most /@ Charting`ScaledTicks[{Identity, Identity}][##] &,
    Most /@ Charting`ScaledFrameTicks[{Identity, Identity}][##] &},
   {Most /@ Charting`ScaledTicks[{Identity, Identity}][##] &,
    Most /@ Charting`ScaledFrameTicks[{Identity, Identity}][##] &}};
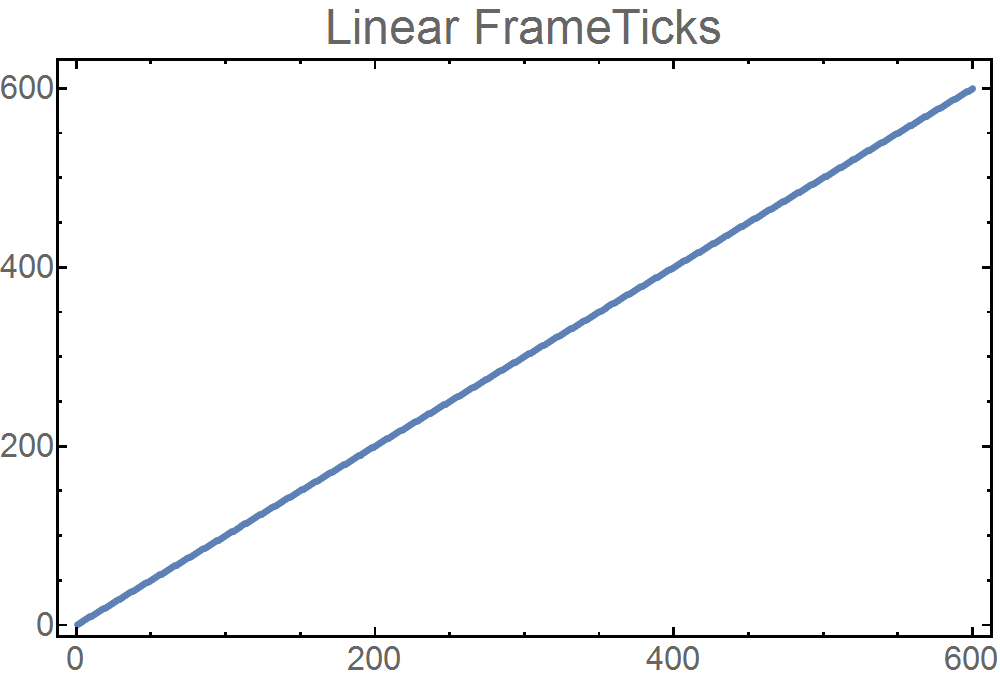
p1 = Show[ListPlot[data, Frame -> True, FrameStyle -> Thickness[.003],
    FrameTicksStyle -> Directive[FontSize -> Scaled[.02], Thickness[.003]]],
   FrameTicks -> linearFrameTicks, PlotLabel -> "Linear FrameTicks",
   LabelStyle -> FontSize -> 40, ImageSize -> 1000];
Export["p1.png", p1, ImageSize -> 1000]
linearLogFrameTicks = {
   {Most /@ Charting`ScaledTicks[{Log, Exp}][##] &,
    Most /@ Charting`ScaledFrameTicks[{Log, Exp}][##] &},
   {Most /@ Charting`ScaledTicks[{Identity, Identity}][##] &,
    Most /@ Charting`ScaledFrameTicks[{Identity, Identity}][##] &}};
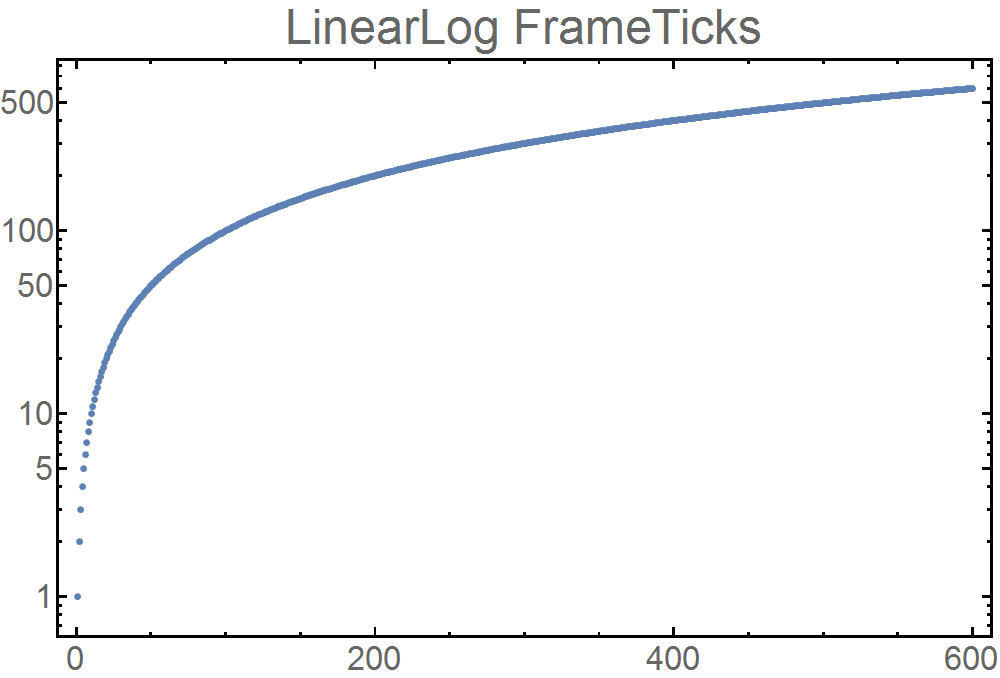
p2 = Show[ListLogPlot[data, Frame -> True, FrameStyle -> Thickness[.003],
    FrameTicksStyle -> Directive[FontSize -> Scaled[.02], Thickness[.003]]],
   FrameTicks -> linearLogFrameTicks, PlotLabel -> "LinearLog FrameTicks",
   LabelStyle -> FontSize -> 40, ImageSize -> 1000];
Export["p2.png", p2, ImageSize -> 1000]
logLinearFrameTicks = {
   {Most /@ Charting`ScaledTicks[{Identity, Identity}][##] &,
    Most /@ Charting`ScaledFrameTicks[{Identity, Identity}][##] &},
   {Most /@ Charting`ScaledTicks[{Log, Exp}][##] &,
    Most /@ Charting`ScaledFrameTicks[{Log, Exp}][##] &}};
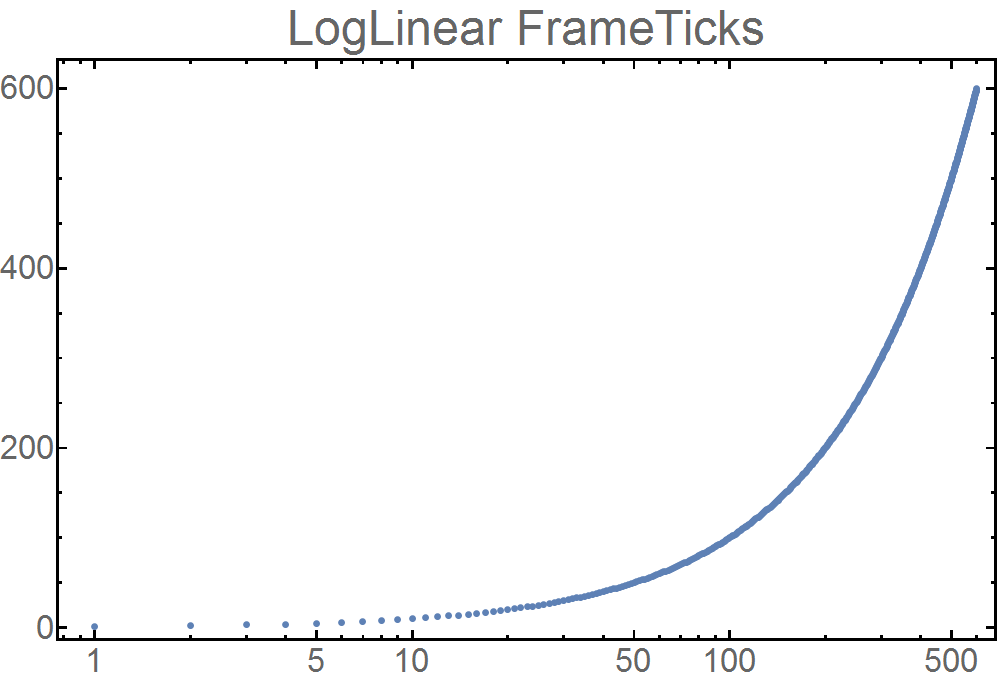
p3 = Show[ListLogLinearPlot[data, Frame -> True, FrameStyle -> Thickness[.003],
    FrameTicksStyle -> Directive[FontSize -> Scaled[.02], Thickness[.003]]],
   FrameTicks -> logLinearFrameTicks, PlotLabel -> "LogLinear FrameTicks",
   LabelStyle -> FontSize -> 40, ImageSize -> 1000];
Export["p3.png", p3, ImageSize -> 1000]
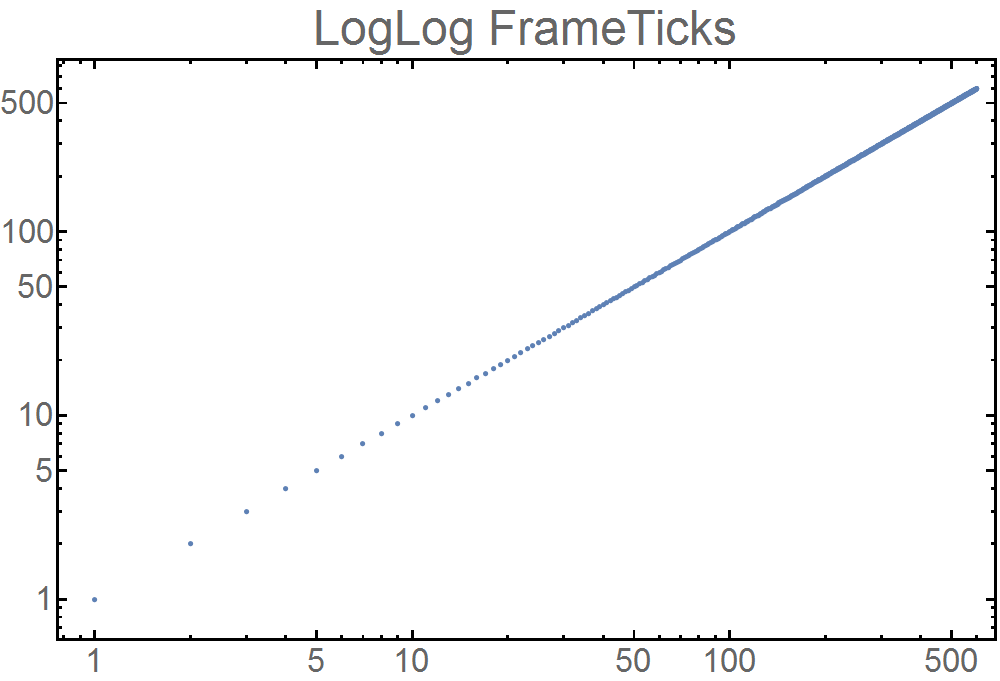
logLogFrameTicks = {
   {Most /@ Charting`ScaledTicks[{Log, Exp}][##] &,
    Most /@ Charting`ScaledFrameTicks[{Log, Exp}][##] &},
   {Most /@ Charting`ScaledTicks[{Log, Exp}][##] &,
    Most /@ Charting`ScaledFrameTicks[{Log, Exp}][##] &}};
p4 = Show[ListLogLogPlot[data, Frame -> True, FrameStyle -> Thickness[.003],
    FrameTicksStyle -> Directive[FontSize -> Scaled[.02], Thickness[.003]]],
   FrameTicks -> logLogFrameTicks, PlotLabel -> "LogLog FrameTicks",
   LabelStyle -> FontSize -> 40, ImageSize -> 1000];
Export["p4.png", p4, ImageSize -> 1000]
