10
$\begingroup$

Is there a default-option possibility to add own defined names of the contour-labels in BarLegend? I want to have a string "hot" for 1 and "cold" for -1 for this:

ContourPlot[Sin[x] Cos[y], {x, 0, 2 Pi}, {y, 0, 2 Pi}, 
 Contours -> {Automatic, 10}, ColorFunction -> "Rainbow", 
 PlotLegends -> BarLegend[Automatic, None]]

How can I do this without writing a separate function?

$\endgroup$
2
  • 1
    $\begingroup$ I believe this should solve the problem. PlotLegends -> BarLegend[Automatic, Method -> {Ticks -> {{-1, "Cold"}, {0, "OK"}, {1, "Hot"}}}] $\endgroup$
    – Szabolcs
    Commented Mar 1, 2015 at 21:44
  • $\begingroup$ @Szabolcs you can drop the Method, putting in Ticks -> ... directly seems to work. $\endgroup$
    – rcollyer
    Commented Sep 7, 2016 at 3:17

1 Answer 1

18
$\begingroup$

Update 3: The issue mentioned in update 2 below is fixed in version 12.0.

Update 2: In version 11.1, the option setting "Ticks" -> {{-1, "cold"}, {0, "ok"}, {1, "hot"}} doesn't work (See Problem with custom ticks in BarLegend in Mathematica 11.1). The tick labels are sorted:

 ContourPlot[Sin[x] Cos[y], {x, 0, 2 Pi}, {y, 0, 2 Pi}, 
  Contours -> {Automatic, 10}, ColorFunction -> "Rainbow", 
  PlotLegends -> BarLegend[Automatic, None, 
   "Ticks" -> {{-1, "cold"}, {0, "ok"}, {1, "hot"}}]]
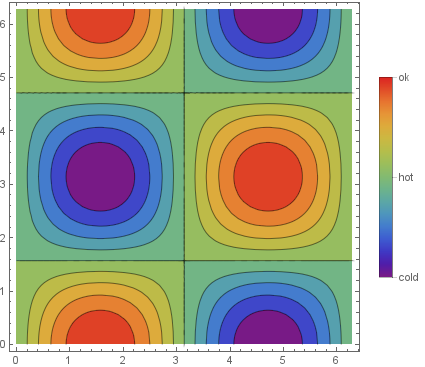
Mathematica graphics

To get the correct labeling of ticks, we can use the option "TickLabels":

ContourPlot[Sin[x] Cos[y], {x, 0, 2 Pi}, {y, 0, 2 Pi}, 
  Contours -> {Automatic, 10}, ColorFunction -> "Rainbow", 
  PlotLegends -> BarLegend[Automatic, None, 
   "Ticks" -> {-1, 0, 1}, "TickLabels" -> {"cold", "ok", "hot"}]]
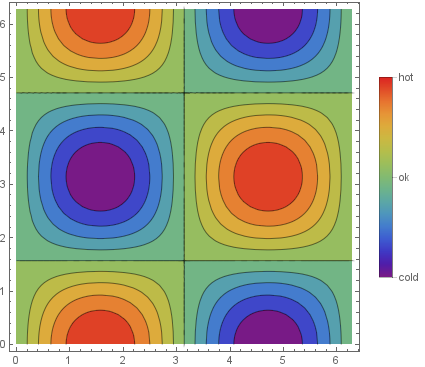
Mathematica graphics

Original post:

You can use the (afaik undocumented) option "Ticks"

ContourPlot[Sin[x] Cos[y], {x, 0, 2 Pi}, {y, 0, 2 Pi}, 
 Contours -> {Automatic, 10}, ColorFunction -> "Rainbow", 
 PlotLegends -> BarLegend[Automatic, None, "Ticks" -> {{-1, "cold"}, {0, "ok"}, {1, "hot"}}]]
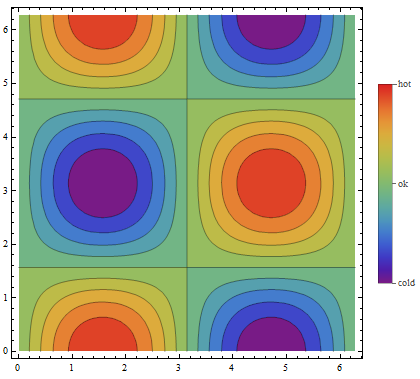
enter image description here

Note: You can also use Ticks instead of "Ticks" and ignore the red highlighting that suggest syntax error.

Update 1: Using additional BarLegend options "TickLabels", "TickSide", "TickLengths":

ContourPlot[Sin[x] Cos[y], {x, 0, 2 Pi}, {y, 0, 2 Pi}, 
 Contours -> {Automatic, 10}, ColorFunction -> "Rainbow", 
 PlotLegends -> BarLegend[Automatic, None, 
   "Ticks" -> {-1, 0, 1}, 
   "TickSide" -> Left, "TickLengths" -> 10, 
   "TickLabels" -> (Style[#, 16] & /@ {"cold", "ok", "hot"})]]
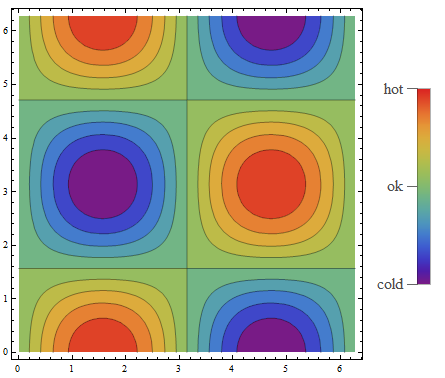
enter image description here

$\endgroup$
8
  • $\begingroup$ I believe you can use any option inside Method, like this. $\endgroup$
    – Szabolcs
    Commented Mar 1, 2015 at 21:45
  • $\begingroup$ @Szabolcs, nice. In version 9 (Windows 8 x 64) we need to use FrameStyle with PlotRangePadding, i.e., Method->{FrameStyle->Thick, PlotRangePadding -> 0}. Without PlotRangePadding->0 we get what looks like two pairs of horizontal frames. $\endgroup$
    – kglr
    Commented Mar 1, 2015 at 22:11
  • $\begingroup$ Thanks, it solves my problem. By the way, it is strange that the option Ticks allowed in other functions highlights in red for this one, but the result is as one can expect. Isn't it an another bug? $\endgroup$
    – szogun
    Commented Mar 2, 2015 at 18:26
  • $\begingroup$ @szogun, you are welcome. Ticks is not a documented option for BarLegend; so I don't think we can call it a bug no matter how it behaves/misbehaves:) $\endgroup$
    – kglr
    Commented Mar 2, 2015 at 18:34
  • $\begingroup$ Running mathematica 11.1.1, the first code listing permutes the positions of "hot" "cold", and "ok" so that "ok" is at the top and "hot" is in the middle. The second code listing still gives the correct output. $\endgroup$ Commented May 12, 2017 at 2:24

Your Answer

By clicking “Post Your Answer”, you agree to our terms of service and acknowledge you have read our privacy policy.

Not the answer you're looking for? Browse other questions tagged or ask your own question.