Update 3: The issue mentioned in update 2 below is fixed in version 12.0.
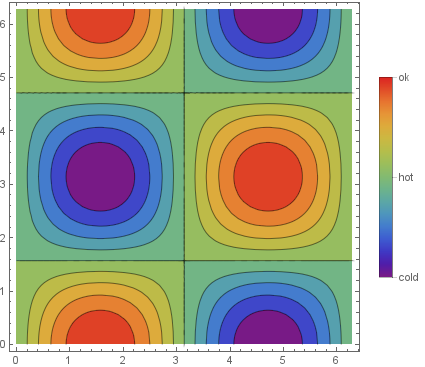
Update 2: In version 11.1, the option setting "Ticks" -> {{-1, "cold"}, {0, "ok"}, {1, "hot"}} doesn't work (See Problem with custom ticks in BarLegend in Mathematica 11.1). The tick labels are sorted:
 ContourPlot[Sin[x] Cos[y], {x, 0, 2 Pi}, {y, 0, 2 Pi},
  Contours -> {Automatic, 10}, ColorFunction -> "Rainbow",
  PlotLegends -> BarLegend[Automatic, None,
   "Ticks" -> {{-1, "cold"}, {0, "ok"}, {1, "hot"}}]]

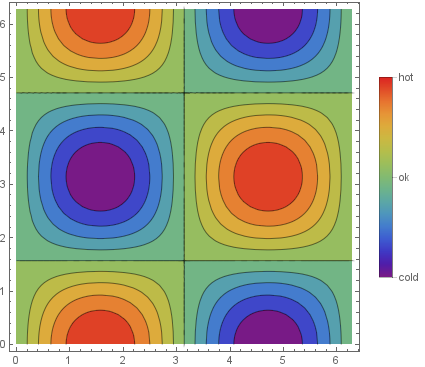
To get the correct labeling of ticks, we can use the option "TickLabels":
ContourPlot[Sin[x] Cos[y], {x, 0, 2 Pi}, {y, 0, 2 Pi},
  Contours -> {Automatic, 10}, ColorFunction -> "Rainbow",
  PlotLegends -> BarLegend[Automatic, None,
   "Ticks" -> {-1, 0, 1}, "TickLabels" -> {"cold", "ok", "hot"}]]

Original post:
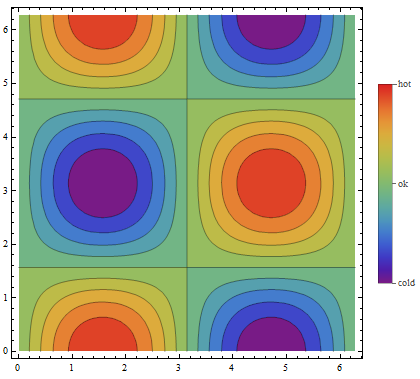
You can use the (afaik undocumented) option "Ticks"
ContourPlot[Sin[x] Cos[y], {x, 0, 2 Pi}, {y, 0, 2 Pi},
 Contours -> {Automatic, 10}, ColorFunction -> "Rainbow",
 PlotLegends -> BarLegend[Automatic, None, "Ticks" -> {{-1, "cold"}, {0, "ok"}, {1, "hot"}}]]

Note: You can also use Ticks instead of "Ticks" and ignore the red highlighting that suggest syntax error.
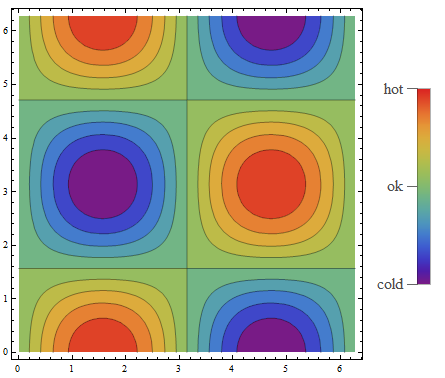
Update 1: Using additional BarLegend options "TickLabels", "TickSide", "TickLengths":
ContourPlot[Sin[x] Cos[y], {x, 0, 2 Pi}, {y, 0, 2 Pi},
 Contours -> {Automatic, 10}, ColorFunction -> "Rainbow",
 PlotLegends -> BarLegend[Automatic, None,
   "Ticks" -> {-1, 0, 1},
   "TickSide" -> Left, "TickLengths" -> 10,
   "TickLabels" -> (Style[#, 16] & /@ {"cold", "ok", "hot"})]]


PlotLegends -> BarLegend[Automatic, Method -> {Ticks -> {{-1, "Cold"}, {0, "OK"}, {1, "Hot"}}}]$\endgroup$Method, putting inTicks -> ...directly seems to work. $\endgroup$