6
$\begingroup$

Whenever I try to fit the sizes of the plot and the BarLegend, it's a struggle.

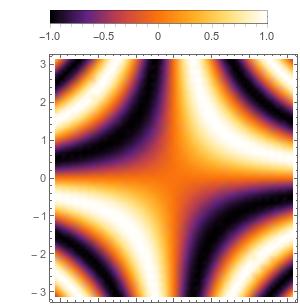
If one sets the same ImageSize, it's ok as long as one does not play with the ImagePadding.

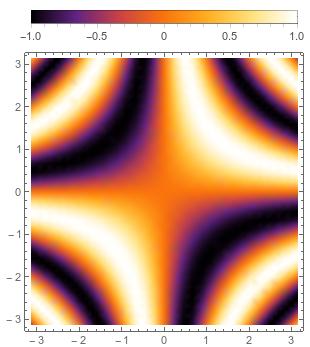
Labeled[DensityPlot[Sin[x y], {x, -Pi, Pi}, {y, -Pi, Pi}, 
  ImageSize -> 300, ColorFunction -> "SunsetColors"], 
 BarLegend[{"SunsetColors", {-1, 1}}, LegendLayout -> "Row", 
  ImageSize -> 300, LegendMarkerSize -> 300], {{Top, Center}}]

enter image description here

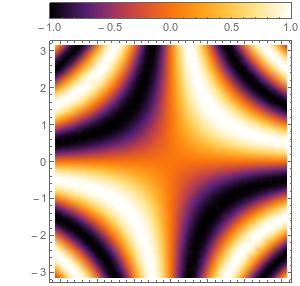
When creating columns/rows of plots, it is crucial to modify the default ImagePadding to fix the size of all plots that I create. But then I do not know how to fit the size of the BarLegend without trial and error - the way its margins work is a mystery (LegendMargins is not really a great option - I find it very frustrating to work with).

Labeled[DensityPlot[Sin[x y], {x, -Pi, Pi}, {y, -Pi, Pi}, 
  ImageSize -> 300, ColorFunction -> "SunsetColors", 
  ImagePadding -> {{50, 2}, {2, 2}}], 
 BarLegend[{"SunsetColors", {-1, 1}}, LegendLayout -> "Row", 
  ImageSize -> 300, LegendMarkerSize -> 250], {{Top, Center}}]

enter image description here

Would greatly appreciate your advice on how to tackle this issue. I'm aware that there were questions about this problem before, but the answers do not really help.

$\endgroup$
5
  • 1
    $\begingroup$ does it help if you change {{Top, Center}} to {{Top, Right}} ? $\endgroup$
    – kglr
    Commented Jul 12, 2018 at 14:56
  • $\begingroup$ @kglr it doesn't really help with the size (played with the suggested option, doesn't look good). The problem is that there is no ImagePadding for BarLegend and the LegendMargins option is, imho, not really working well. $\endgroup$ Commented Jul 12, 2018 at 15:04
  • $\begingroup$ Gregory, could you check if ipad = {{50, 8}, {2, 2}}; Legended[DensityPlot[Sin[x y], {x, -Pi, Pi}, {y, -Pi, Pi}, ImageSize -> 300, ColorFunction -> "SunsetColors", ImagePadding -> ipad, PlotRangeClipping -> False], Placed[BarLegend[{"SunsetColors", {-1, 1}}, LegendLayout -> "Row", Method -> {ImageSize -> 300, ImagePadding -> {{0, 0}, {20, 0}} + ipad}], {Above, Right}]] works in your version/os. It works in version 9 / windows 10. $\endgroup$
    – kglr
    Commented Jul 13, 2018 at 6:41
  • $\begingroup$ DensityPlot[Sin[x y], {x, -Pi, Pi}, {y, -Pi, Pi}, ImageSize -> 300, ColorFunction -> "SunsetColors", ImagePadding -> ipad, PlotRangeClipping -> False, PlotLegends -> Placed[BarLegend[{"SunsetColors", {-1, 1}}, LegendLayout -> "Row", Method -> {ImageSize -> 300, ImagePadding -> ipad + {{0, 0}, {0, 20}}}], {Above, Right}]] also works in v9/w10. $\endgroup$
    – kglr
    Commented Jul 13, 2018 at 6:45
  • $\begingroup$ @kglr Nope - both of them do not work:-(. Using v11.1.1/w10. It's like Mathematica didn't actually see ImagePadding inside the Method option. $\endgroup$ Commented Jul 13, 2018 at 8:25

2 Answers 2

4
$\begingroup$

Here's a workaround that might help others in the future: do not use BarLegend and create your own bar using DensityPlot. This way one gets the ImagePadding option.

Here's an example that works perfectly.

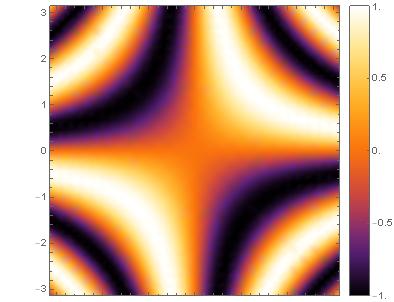
Horizontal bar legend

myBarPlot = 
 DensityPlot[x, {x, -1, 1}, {y, -1, 1}, 
  PlotRange -> {{-1, 1}, {-1, 1}}, ColorFunction -> "SunsetColors", 
  AspectRatio -> 1/15, FrameTicks -> {{None, None}, {True, None}}, 
  ImagePadding -> {{50, 8}, {20, 2}}, ImageSize -> 300];

Column[{myBarPlot, 
  DensityPlot[Sin[x y], {x, -Pi, Pi}, {y, -Pi, Pi}, ImageSize -> 300, 
   ColorFunction -> "SunsetColors", 
   ImagePadding -> {{50, 8}, {2, 2}}]}, Spacings -> 0]

enter image description here

Vertical bar legend Second case, suggested by @OkkesDulgerci

myBarPlotVertical = 
 DensityPlot[y, {x, -1, 1}, {y, -1, 1}, 
  PlotRange -> {{-1, 1}, {-1, 1}}, ColorFunction -> "SunsetColors", 
  AspectRatio -> 15, FrameTicks -> {{None, All}, {None, None}}, 
  ImagePadding -> {{2, 25}, {5, 5}}, ImageSize -> {Automatic, 300}];

Row[{DensityPlot[Sin[x y], {x, -Pi, Pi}, {y, -Pi, Pi}, 
   ImageSize -> {Automatic, 300}, ColorFunction -> "SunsetColors", 
   ImagePadding -> {{50, 8}, {5, 5}}, PlotRangePadding -> None], 
  myBarPlotVertical}]

enter image description here

Still, would be great to know, if there's an "official" way to do it using BarLegend.

$\endgroup$
3
  • 1
    $\begingroup$ Additionally, one can use PlotRangePadding -> None in the plot to lose the white areas by the frame ticks. $\endgroup$ Commented Jul 12, 2018 at 15:24
  • 1
    $\begingroup$ Here is the vertical barlegend DensityPlot[y, {x, 0, 4}, {y, 0, 4}, AspectRatio -> 15, ColorFunction -> "ThermometerColors", FrameTicks -> {{None, All}, {None, None}}, ImagePadding -> {{1, 15}, {8, 8}}, PlotRangePadding -> None, ImageSize -> 30] $\endgroup$ Commented Jul 13, 2018 at 0:21
  • $\begingroup$ @OkkesDulgerci good point, added this case as well. $\endgroup$ Commented Jul 13, 2018 at 8:17
2
$\begingroup$

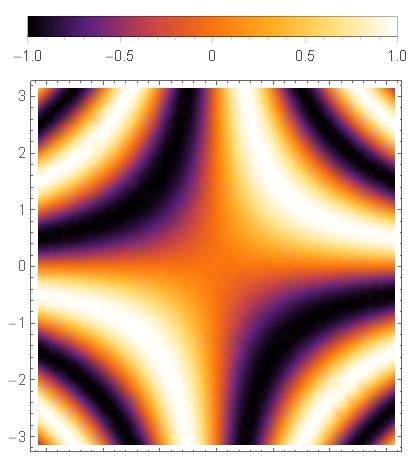
You gave a good answer. However, in addition to that, here is the one based on using the standard technique:

DensityPlot[Sin[x y], {x, -Pi, Pi}, {y, -Pi, Pi}, ImageSize -> 300, 
 ImagePadding -> {{50, 2}, {2, 2}}, ColorFunction -> "SunsetColors", 
 PlotLegends -> 
  Placed[Row[{Spacer[30], 
     BarLegend[{"SunsetColors", {-1, 1}}, LegendLayout -> "Row", 
      LegendMarkerSize -> 300 - 26]}], {Above, Center}]]

enter image description here

One can play with two parameters to adjust the size and position: (1) the argument of the Spacer as well as with (2) the value of the LegendMarkerSize.

Have fun!

$\endgroup$
1
  • $\begingroup$ This Spacer is a nice thing, didn't know about it! Feels like a workaround as well though (since, a you said, one has to play with 2 parameters - there's no systematic way of dealing with the legend). I think that the problem lies in the margins of the BarLegend - they are i) unknown, ii) uneven. $\endgroup$ Commented Jul 13, 2018 at 9:38

Your Answer

By clicking “Post Your Answer”, you agree to our terms of service and acknowledge you have read our privacy policy.

Not the answer you're looking for? Browse other questions tagged or ask your own question.