3
$\begingroup$

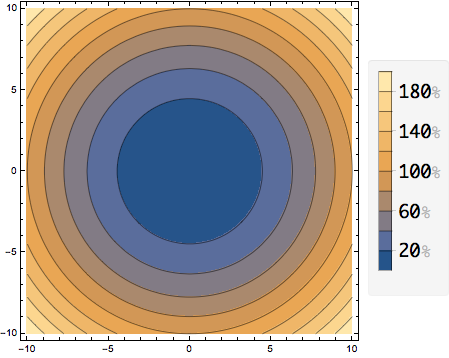
Is there any way to get the '%' in the BarLegend to be black instead of light gray?

ContourPlot[x^2 + y^2, {x, -10, 10}, {y, -10, 10}, 
PlotLegends -> BarLegend[Automatic, LegendFunction -> "Panel",
   LabelStyle -> {FontFamily -> "Monaco", FontSize -> 18, 
   FontColor -> Black}],
FrameStyle -> Black,
TargetUnits -> "%"]
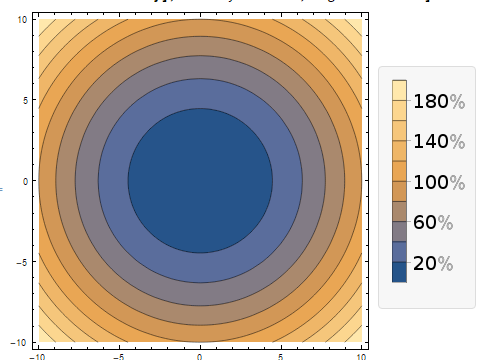
ContourPlot with barLegend and Units (in different style)

$\endgroup$
1
  • $\begingroup$ This doesn't seem to work in MMA 13.0.1 any longer... $\endgroup$
    – Ranza
    Commented Apr 3, 2022 at 13:56

1 Answer 1

4
$\begingroup$
cp = ContourPlot[x^2 + y^2, {x, -10, 10}, {y, -10, 10},
 PlotLegends -> BarLegend[Automatic, LegendFunction -> "Panel",
 LabelStyle -> {FontFamily -> "Monaco", FontSize -> 18,
 FontColor -> Black}], FrameStyle -> Black, TargetUnits -> "%"]

Mathematica graphics

FullForm[cp[[2,1]]] gives the code that constructs the legend. Inspecting that code we find the piece that we need to modify:

Rule[Charting`TickAnnotations, Style[QuantityForm["Percent", "PlotLabel"], GrayLevel[0.7`]]]

So using the following replacement rule

graytoblack = Rule[Charting`TickAnnotations, Style[q_,GrayLevel[_]]]:>
    Rule[Charting`TickAnnotations,   Style[q,GrayLevel[0]]];

to post-process cp

cp/.graytoblack

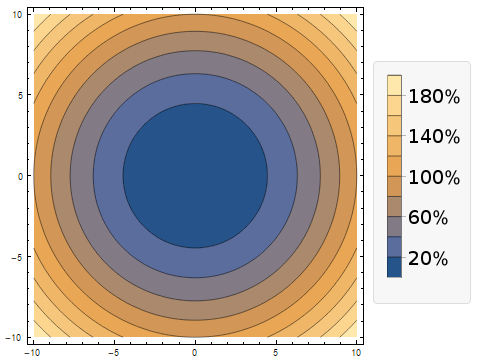
we get:
Mathematica graphics

$\endgroup$
1
  • $\begingroup$ You could have used the simpler cp /. GrayLevel[0.7`]->GrayLevel[0]; but this would have changed all GrayLevel[0.7`] elements, not just the "%" in the legend. $\endgroup$
    – kglr
    Commented Mar 1, 2016 at 4:46

Your Answer

By clicking “Post Your Answer”, you agree to our terms of service and acknowledge you have read our privacy policy.

Not the answer you're looking for? Browse other questions tagged or ask your own question.