added explanation
Source Link
Grzegorz Rut
  • 1.2k
  • 8
  • 19

Here's a workaround that might help others in the future: do not use BarLegend and create your own bar using DensityPlot. This way one gets the ImagePadding option.

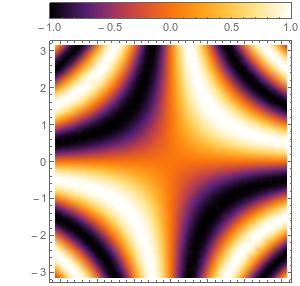
Here's an example that works perfectly.

Horizontal bar legend

myBarPlot = 
 DensityPlot[x, {x, -1, 1}, {y, -1, 1}, 
  PlotRange -> {{-1, 1}, {-1, 1}}, ColorFunction -> "SunsetColors", 
  AspectRatio -> 1/15, FrameTicks -> {{None, None}, {True, None}}, 
  ImagePadding -> {{50, 8}, {20, 2}}, ImageSize -> 300];

Column[{myBarPlot, 
  DensityPlot[Sin[x y], {x, -Pi, Pi}, {y, -Pi, Pi}, ImageSize -> 300, 
   ColorFunction -> "SunsetColors", 
   ImagePadding -> {{50, 8}, {2, 2}}]}, Spacings -> 0]

enter image description here

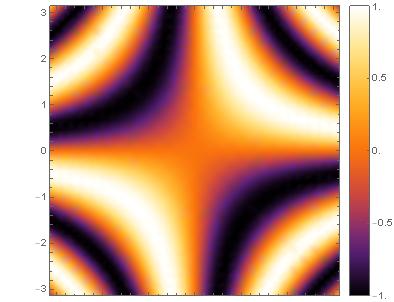
Vertical bar legend Second case, suggested by @OkkesDulgerci

myBarPlotVertical = 
 DensityPlot[y, {x, -1, 1}, {y, -1, 1}, 
  PlotRange -> {{-1, 1}, {-1, 1}}, ColorFunction -> "SunsetColors", 
  AspectRatio -> 15, FrameTicks -> {{None, All}, {None, None}}, 
  ImagePadding -> {{2, 25}, {5, 5}}, ImageSize -> {Automatic, 300}];

Row[{DensityPlot[Sin[x y], {x, -Pi, Pi}, {y, -Pi, Pi}, 
   ImageSize -> {Automatic, 300}, ColorFunction -> "SunsetColors", 
   ImagePadding -> {{50, 8}, {5, 5}}, PlotRangePadding -> None], 
  myBarPlotVertical}]

enter image description here

Still, would be great to know, if there's an "official" way to do it using BarLegend.

Here's a workaround that might help others in the future: do not use BarLegend and create your own bar using DensityPlot. This way one gets the ImagePadding option.

Here's an example that works perfectly.

myBarPlot = 
 DensityPlot[x, {x, -1, 1}, {y, -1, 1}, 
  PlotRange -> {{-1, 1}, {-1, 1}}, ColorFunction -> "SunsetColors", 
  AspectRatio -> 1/15, FrameTicks -> {{None, None}, {True, None}}, 
  ImagePadding -> {{50, 8}, {20, 2}}, ImageSize -> 300];

Column[{myBarPlot, 
  DensityPlot[Sin[x y], {x, -Pi, Pi}, {y, -Pi, Pi}, ImageSize -> 300, 
   ColorFunction -> "SunsetColors", 
   ImagePadding -> {{50, 8}, {2, 2}}]}, Spacings -> 0]

enter image description here

Still, would be great to know, if there's an "official" way to do it using BarLegend.
Here's a workaround that might help others in the future: do not use BarLegend and create your own bar using DensityPlot. This way one gets the ImagePadding option.

Here's an example that works perfectly.

Horizontal bar legend

myBarPlot = 
 DensityPlot[x, {x, -1, 1}, {y, -1, 1}, 
  PlotRange -> {{-1, 1}, {-1, 1}}, ColorFunction -> "SunsetColors", 
  AspectRatio -> 1/15, FrameTicks -> {{None, None}, {True, None}}, 
  ImagePadding -> {{50, 8}, {20, 2}}, ImageSize -> 300];

Column[{myBarPlot, 
  DensityPlot[Sin[x y], {x, -Pi, Pi}, {y, -Pi, Pi}, ImageSize -> 300, 
   ColorFunction -> "SunsetColors", 
   ImagePadding -> {{50, 8}, {2, 2}}]}, Spacings -> 0]

enter image description here

Vertical bar legend Second case, suggested by @OkkesDulgerci

myBarPlotVertical = 
 DensityPlot[y, {x, -1, 1}, {y, -1, 1}, 
  PlotRange -> {{-1, 1}, {-1, 1}}, ColorFunction -> "SunsetColors", 
  AspectRatio -> 15, FrameTicks -> {{None, All}, {None, None}}, 
  ImagePadding -> {{2, 25}, {5, 5}}, ImageSize -> {Automatic, 300}];

Row[{DensityPlot[Sin[x y], {x, -Pi, Pi}, {y, -Pi, Pi}, 
   ImageSize -> {Automatic, 300}, ColorFunction -> "SunsetColors", 
   ImagePadding -> {{50, 8}, {5, 5}}, PlotRangePadding -> None], 
  myBarPlotVertical}]

enter image description here

Still, would be great to know, if there's an "official" way to do it using BarLegend.
Source Link
Grzegorz Rut
  • 1.2k
  • 8
  • 19

Here's a workaround that might help others in the future: do not use BarLegend and create your own bar using DensityPlot. This way one gets the ImagePadding option.

Here's an example that works perfectly.

myBarPlot = 
 DensityPlot[x, {x, -1, 1}, {y, -1, 1}, 
  PlotRange -> {{-1, 1}, {-1, 1}}, ColorFunction -> "SunsetColors", 
  AspectRatio -> 1/15, FrameTicks -> {{None, None}, {True, None}}, 
  ImagePadding -> {{50, 8}, {20, 2}}, ImageSize -> 300];

Column[{myBarPlot, 
  DensityPlot[Sin[x y], {x, -Pi, Pi}, {y, -Pi, Pi}, ImageSize -> 300, 
   ColorFunction -> "SunsetColors", 
   ImagePadding -> {{50, 8}, {2, 2}}]}, Spacings -> 0]

enter image description here

Still, would be great to know, if there's an "official" way to do it using BarLegend.