5
$\begingroup$

I have some Table of {x,y,z} values (energy as a function of radial and azimuthal frequencies in a galaxy if you care to know):

dat = Import["https://dl.dropboxusercontent.com/u/659996/odd-data.m"];

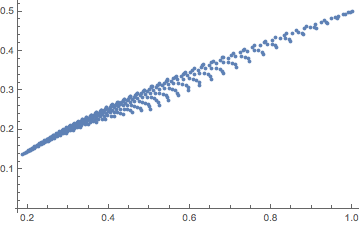
If I plot the position of the {x,y}

pl1 = Most /@ Flatten[dat, 1] // ListPlot

I get this
Mathematica graphics

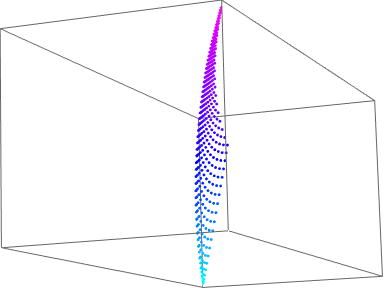
Note that there is nothing pathological in the distribution of points as seen from this 3D view

Map[{Hue[#[[3]]], Point[#]} &, Flatten[dat, 1]] // Graphics3D
Mathematica graphics

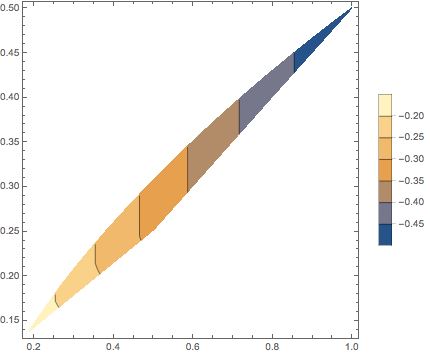
If I now plot contours of z[x,y], I get that:

pl2 = ListContourPlot[Flatten[dat, 1], PlotLegends -> Automatic,PlotRange -> All]
Mathematica graphics

PROBLEM

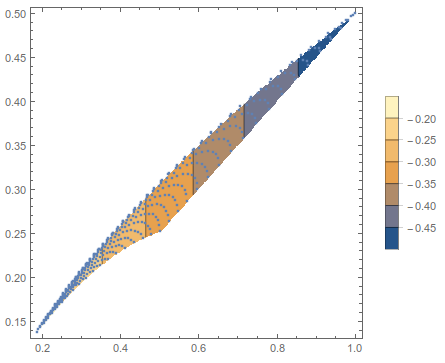
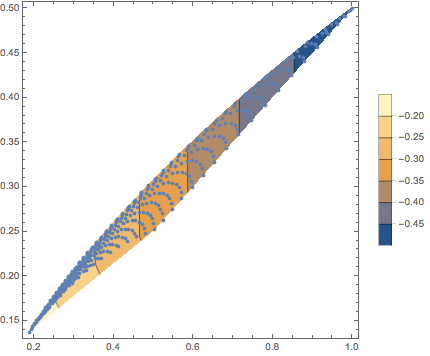
Now the puzzling fact is that it seems Mathematica gives me contours at values of {x,y} which I have not sampled. This is best seen in the superposition:

Show[pl2, pl1]
Mathematica graphics

e.g. for values of x=0.3 y=0.175.

QUESTION

Is this a bug?

or am I missing something obvious?

UPDATE

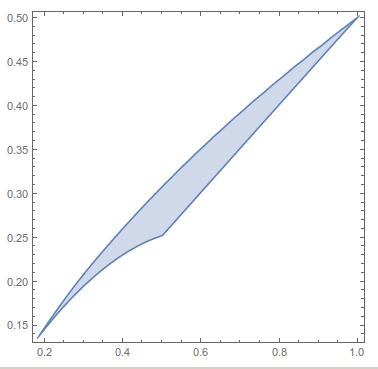
I guess Mathematica cannot guess any obvious boundary to my sets of x,y coordinates other than the Convex Hull has mentioned by @belisarius so the Bug is in my head.

$\endgroup$
3
  • $\begingroup$ @belisarius indeed it does but you find it makes sense to extrapolate on the convex hull? $\endgroup$
    – chris
    Commented Feb 3, 2015 at 17:08
  • $\begingroup$ Looks like the correct partition of the space based on $z$ values, which needn't conform to the sampling of the (x,y) space, any more than the elevation of a mountain range must conform to the sampling of latitude and longitude. $\endgroup$ Commented Feb 3, 2015 at 17:08
  • 1
    $\begingroup$ See mathematica.stackexchange.com/a/69102/193 $\endgroup$ Commented Feb 3, 2015 at 17:09

1 Answer 1

6
$\begingroup$

It is possible to restrict the plotting region by using RegionFunction. However, it is also necessary to construct a concave hull of the data, and use a higher MaxPlotPoints when making the contour plot. Using RunnyKine's code from here to construct the region,

dat = Flatten[
   Import["https://dl.dropboxusercontent.com/u/659996/odd-data.m"], 1];
reg = alphaShapes2D[DeleteDuplicates@dat[[All, ;; 2]], .33];
RegionPlot[reg]

enter image description here

We can now get the proper contour plot,

Show[
 ListContourPlot[dat, PlotLegends -> Automatic, PlotRange -> All, 
  RegionFunction -> Function[{x, y, z}, RegionMember[reg, {x, y}]], 
  MaxPlotPoints -> 100],
 ListPlot@dat[[All, ;; 2]]
 ]

enter image description here

$\endgroup$

Your Answer

By clicking “Post Your Answer”, you agree to our terms of service and acknowledge you have read our privacy policy.

Not the answer you're looking for? Browse other questions tagged or ask your own question.