I want to use NMaximize to find the maximum value given by one interpolation function with respect to a constraint given by a second interpolation function. The main problem is that NMaximize produces a warning when running that says "InterpolatingFunction::dmval: Input value {value} lies outside the range of data in the interpolating function. Extrapolation will be used." I want to force NMaximize to only work with points inside the domain where interpolation can be used so that extrapolation is avoided. I attempted to do this by adding inequalities to the constraints that indicate the values in the region where the interpolation was done and also by forcing NMaximize to start near where I suspect the optimal value to be.
I've tried this in the following way:
f1 = Interpolation[logdata1, InterpolationOrder -> 3];
f2 = Interpolation[data2, InterpolationOrder -> 3];
point = Import["inits.txt", "Table"];
NMaximize[{f2[x, y, z], f1[x, y, z] <= Log[0.5], 4 <= x <= 5.5,
  0.5 <= y <= 2, 0.4 <= z <= 1.07}, {x, y, z},
 Method -> {"Automatic", "InitialPoints" -> point}]
"point" is just a table with one row containing the values 4.5,1.25,and 0.76. This is what I determined the optimal discrete value to be so I want to use it as a start point.
The region for interpolation is given by 4 <= x <= 5.5,0.5 <= y <= 2, 0.4 <= z <= 1.07
I've also tried the following to force NMaximize to stay within the interpolation domain:
R1 = ConvexHullMesh[logdata1[[All, 1]]];
R2 = ConvexHullMesh[data2[[All, 1]]];
R = RegionIntersection[R1, R2];
NMaximize[{f2[x, y, z], f1[x, y, z] <= Log[0.5]}, {x, y, z} \[Element] R,
 Method -> {"Automatic", "InitialPoints" -> point}]
But this actually gives the same exact results as the above code and has the same issue.
My main questions are:
- How can I force NMaximize to only work with values within the region of interpolation?
- Why do I get a different answer when I use interpolation order of 2 for f1 instead of 3?
- How do I know that I can trust the accuracy of the interpolating functions/optimization?
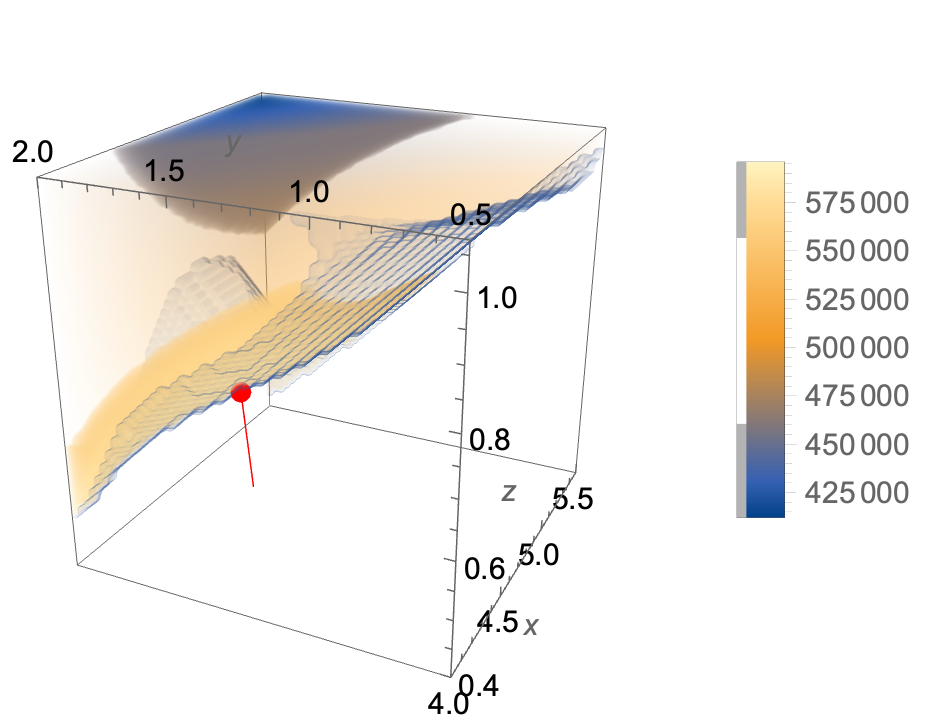
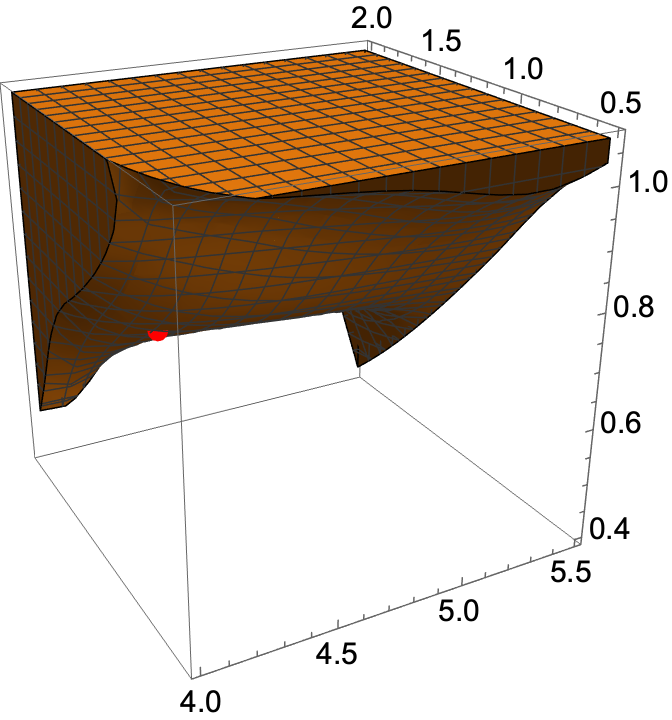
- Any suggestions for visualizing the results?
I know that similar posts have been listed in the comments but I don't fully understand either method proposed. Any help either understanding those posts or finding other methods is very appreciated. Thank you!
Below is the data that I used in case it is needed:
logdata1 = {{{4.0, 1.25, 0.45},
    2.4476110710053582}, {{4.0, 2.0,
     0.45}, -0.4760070040170787}, {{4.5, 1.25, 0.45},
    2.1639608012496088}, {{4.5, 2.0, 0.45},
    0.5303864073024669}, {{5.0, 1.25, 0.45},
    1.9622857635137856}, {{5.0, 2.0, 0.45},
    1.9488846460698512}, {{5.5, 1.25, 0.45},
    1.8139919050322073}, {{5.5, 2.0,
     0.45}, -0.9527028993939473}, {{4.0, 0.5, 0.605},
    4.059260222075511}, {{4.0, 1.25, 0.605},
    0.9332419979067259}, {{4.0, 2.0,
     0.605}, -0.9612143012617799}, {{4.5, 0.5, 0.605},
    4.850402604347952}, {{4.5, 1.25, 0.605},
    0.6549376656053791}, {{4.5, 2.0,
     0.605}, -0.27196613541994935}, {{5.0, 1.25, 0.605},
    0.4669707790329627}, {{5.0, 2.0, 0.605},
    0.9180799618231699}, {{5.5, 0.5, 0.605},
    4.531939978304144}, {{5.5, 1.25, 0.605},
    0.3212005070088676}, {{5.5, 2.0,
     0.605}, -2.0627765675879792}, {{4.0, 0.5, 0.76},
    2.4284995329088637}, {{4.0, 1.25,
     0.76}, -0.1051143992907932}, {{4.0, 2.0,
     0.76}, -0.8832538784145662}, {{4.5, 0.5, 0.76},
    3.1644735438592906}, {{4.5, 1.25,
     0.76}, -0.7288545733720814}, {{4.5, 2.0,
     0.76}, -1.1551175665109155}, {{5.0, 0.5, 0.76},
    4.518119732686612}, {{5.0, 1.25,
     0.76}, -0.9533340580032796}, {{5.0, 2.0,
     0.76}, -0.18352510547611892}, {{5.5, 0.5, 0.76},
    2.8849673931650806}, {{5.5, 1.25,
     0.76}, -1.08780166364667}, {{5.5, 2.0,
     0.76}, -3.1244191934660304}, {{4.0, 0.5, 0.915},
    0.7786084895594321}, {{4.0, 1.25,
     0.915}, -0.8728949665399017}, {{4.0, 2.0,
     0.915}, -1.17603596087305}, {{4.5, 0.5, 0.915},
    2.1786298628411367}, {{4.5, 1.25,
     0.915}, -1.6388818066168709}, {{4.5, 2.0,
     0.915}, -1.55409279971176}, {{5.0, 0.5, 0.915},
    1.402255994802939}, {{5.0, 1.25,
     0.915}, -2.1364423513977218}, {{5.0, 2.0,
     0.915}, -2.2235681116987904}, {{5.5, 0.5, 0.915},
    1.208128358101143}, {{5.5, 1.25,
     0.915}, -2.5425674236742957}, {{5.5, 2.0,
     0.915}, -4.462884577816279}, {{4.0, 0.5,
     1.07}, -0.1500180481707993}, {{4.0, 1.25,
     1.07}, -0.8100261071745211}, {{4.0, 2.0,
     1.07}, -0.8624884008823027}, {{4.5, 0.5,
     1.07}, -1.1169819037162614}, {{4.5, 1.25,
     1.07}, -2.52249142770252}, {{4.5, 2.0,
     1.07}, -2.6378648565587306}, {{5.0, 0.5,
     1.07}, -1.4465141616100985}, {{5.0, 1.25,
     1.07}, -3.335689123362051}, {{5.0, 2.0,
     1.07}, -3.769595502304815}, {{5.5, 0.5,
     1.07}, -1.4758738651819627}, {{5.5, 1.25,
     1.07}, -3.7132682217485584}, {{5.5, 2.0,
     1.07}, -4.654076972414527}, {{4.0, 0.5, 0.45},
    5.353657461581201}, {{4.5, 0.5, 0.45},
    6.465506884780405}, {{5.0, 0.5, 0.45},
    7.412341477958108}, {{5.0, 0.5, 0.605},
    6.133636626247068}, {{5.5, 0.5, 0.45}, 6.132768777805711}};

data2 = {{{4.0, 1.25, 0.45},
    827963.4278091961}, {{4.0, 2.0, 0.45},
    600968.389587756}, {{4.5, 1.25, 0.45},
    811646.576130428}, {{4.5, 2.0, 0.45},
    581220.328739186}, {{5.0, 1.25, 0.45},
    800973.007076825}, {{5.0, 2.0, 0.45},
    568570.203769995}, {{5.5, 1.25, 0.45},
    794017.756771696}, {{5.5, 2.0, 0.45},
    560213.396935101}, {{4.0, 0.5, 0.605},
    838950.27758945}, {{4.0, 1.25, 0.605},
    688775.333493315}, {{4.0, 2.0, 0.605},
    561752.068527685}, {{4.5, 0.5, 0.605},
    817733.35451236}, {{4.5, 1.25, 0.605},
    666198.092749207}, {{4.5, 2.0, 0.605},
    536817.008337762}, {{5.0, 1.25, 0.605},
    651170.6667152981}, {{5.0, 2.0, 0.605},
    520182.0224774009}, {{5.5, 0.5, 0.605},
    793588.1419891589}, {{5.5, 1.25, 0.605},
    640681.7856759089}, {{5.5, 2.0, 0.605},
    508701.99849301507}, {{4.0, 0.5, 0.76},
    689654.996746875}, {{4.0, 1.25, 0.76},
    611683.167247716}, {{4.0, 2.0, 0.76},
    531730.603245925}, {{4.5, 0.5, 0.76},
    663248.496983644}, {{4.5, 1.25, 0.76},
    584549.964560992}, {{4.5, 2.0, 0.76},
    502723.19077599095}, {{5.0, 0.5, 0.76},
    644962.463115578}, {{5.0, 1.25, 0.76},
    565791.185474893}, {{5.0, 2.0, 0.76},
    482696.72586706094}, {{5.5, 0.5, 0.76},
    632120.948971156}, {{5.5, 1.25, 0.76},
    552439.312601659}, {{5.5, 2.0, 0.76},
    468594.012480716}, {{4.0, 0.5, 0.915},
    608517.065299336}, {{4.0, 1.25, 0.915},
    562326.6690796369}, {{4.0, 2.0, 0.915},
    508709.0361146391}, {{4.5, 0.5, 0.915},
    578138.227790258}, {{4.5, 1.25, 0.915},
    531370.257938272}, {{4.5, 2.0, 0.915},
    476325.162144433}, {{5.0, 0.5, 0.915},
    556771.4056356569}, {{5.0, 1.25, 0.915},
    509519.839716492}, {{5.0, 2.0, 0.915},
    453514.3685128}, {{5.5, 0.5, 0.915},
    541345.0278164339}, {{5.5, 1.25, 0.915},
    493845.13464755006}, {{5.5, 2.0, 0.915},
    437127.722716284}, {{4.0, 0.5, 1.07},
    557993.383995382}, {{4.0, 1.25, 1.07},
    528343.954567613}, {{4.0, 2.0, 1.07},
    491109.63353426}, {{4.5, 0.5, 1.07},
    524463.329549847}, {{4.5, 1.25, 1.07},
    494319.026567362}, {{4.5, 2.0, 1.07},
    455866.45703618496}, {{5.0, 0.5, 1.07},
    500543.046316201}, {{5.0, 1.25, 1.07},
    470037.50360640406}, {{5.0, 2.0, 1.07},
    430649.63382796705}, {{5.5, 0.5, 1.07},
    483029.903555676}, {{5.5, 1.25, 1.07},
    452284.83559607796}, {{5.5, 2.0, 1.07},
    412284.058496425}, {{4.0, 0.5, 0.45},
    1222680.0}, {{4.5, 0.5, 0.45}, 1209000.0}, {{5.0, 0.5, 0.45},
    1200080.0}, {{5.0, 0.5, 0.605}, 803280.0}, {{5.5, 0.5, 0.45},
    1194050.0}};


NMinimizecan step outside the constraints, but eventually enforces them in the answer. When it steps outside the constraints, you get aInterpolatingFunction::dmvalmessage. But if the answer is inside the constraints, then I doubt extrapolation has invalidated the answer. Is there some reason to doubt the result, other than the extrapolation warning? $\endgroup$InterpolatingFunctionwhenNMinimizesteps outside the constraints. But the answer returned is within the constraints. So the step outside the constraint is rejected, and you can ignore the warning message. $\endgroup$NMinimizeto fail to work properly. $\endgroup$