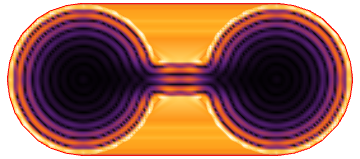
OK,
A first partial answer can be found from deep in the documentation (under Options->Mesh): "The entire mesh for irregular data is a Delaunay triangulation". My mesh is of course not irregular; my boundary is, and what I see is a Delaunay triangulation of my mesh. The surprise is that using the RegionFunction still shows the whole mesh, including parts outside the region.
A solution is to overlay the plot with the negation of the function that tests whether points are inside RegionPlot[\[Not] in[i, j], {i, -xm, xm}, {j, -ym, ym},
ColorFunction -> Function[{x, y, z}, White], BoundaryStyle->None].
That works, by just using Show.
Niels


RegionFunctionwith whatever generated your first plot to restrict the plot to your domain of interest. But then, where is the code for generating your region? $\endgroup$insidedumb[i_, j_, r_, o_, d_] := (i - r - o)^2 + j^2 <= r^2 \[Or] (i + r + o)^2 + j^2 <= r^2 \[Or] (-o <= i <= o \[And] -d <= j <= d)$\endgroup$ListDensityPlotcode that creates the plot. $\endgroup$