I'm trying to create an Implicit Region in the following way:
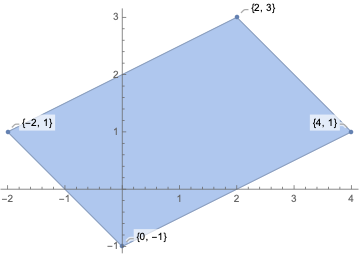
Let's say the 2D region is defined as
(* for -1 < e1, e2 < 1 *)
{x, y} = {1, 1} + e1 {1, -1} + e2 {2, 1};
I can draw this region with some difficulty by generating all the corners and computing the convex hull
{x, y} /. Thread /@ ({e1, e2} -> #1 &) /@ Tuples[{-1, 1}, 2] //
 Show[ConvexHullMesh[#], ListPlot[Callout /@ #], Axes -> True] &
Although this method would break down if the region was a bit bit more complicated say
{x, y} = {1, 1} + Tanh[e1 {1, -1}] + e2 {2, 1};
My attempt was to try this
ImplicitRegion[
 x == 1 + e1 + 2 e2 &&
  y == 1 + e2 - e1 && -1 < e1 < 1 && -1 < e2 < 1, {x, y}]//RegionPlot
but unfortunately ImplicitRegion can only handle contraints that use it's variables.
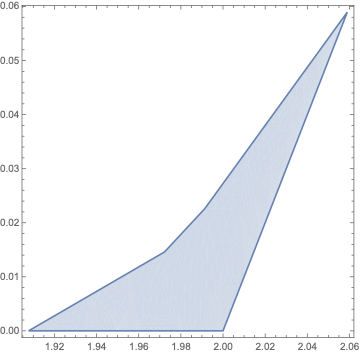
Any ideas to help visualize more complicated regions of this form would be appreciated. Here's an example of one I'd like to see
{x, y} = {Ramp[-0.911` (1 + Subscript[\[Epsilon], 1]/10) +
    1.72` (2 + Subscript[\[Epsilon], 2]/10)],
  Ramp[-0.886` (1 + Subscript[\[Epsilon], 1]/10) +
    0.242` (2 + Subscript[\[Epsilon], 2]/10)]}
where
-1 < Subscript[\[Epsilon], _] < 1


ParametricRegion[...]andRegion[ParametricRegion[...]]to visualize. This works withTanhexample, but unfortunately gives empty plot for the lastRampexample. $\endgroup$