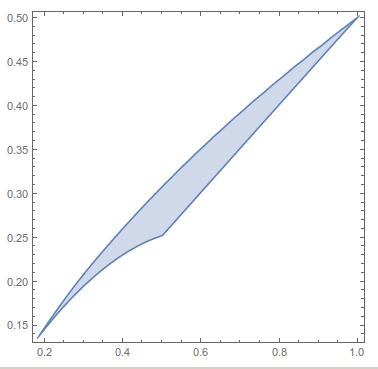
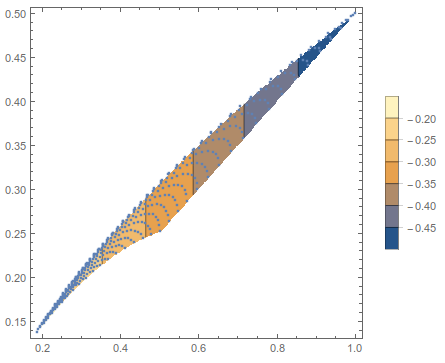
It is possible to restrict the plotting region by using RegionFunction. However, it is also necessary to construct a concave hull of the data, and use a higher MaxPlotPoints when making the contour plot. Using RunnyKine's code from herehere to construct the region,
dat = Flatten[
   Import["https://dl.dropboxusercontent.com/u/659996/odd-data.m"], 1];
reg = alphaShapes2D[DeleteDuplicates@dat[[All, ;; 2]], .33];
RegionPlot[reg]
We can now get the proper contour plot,
Show[
 ListContourPlot[dat, PlotLegends -> Automatic, PlotRange -> All,
  RegionFunction -> Function[{x, y, z}, RegionMember[reg, {x, y}]],
  MaxPlotPoints -> 100],
 ListPlot@dat[[All, ;; 2]]
 ]


