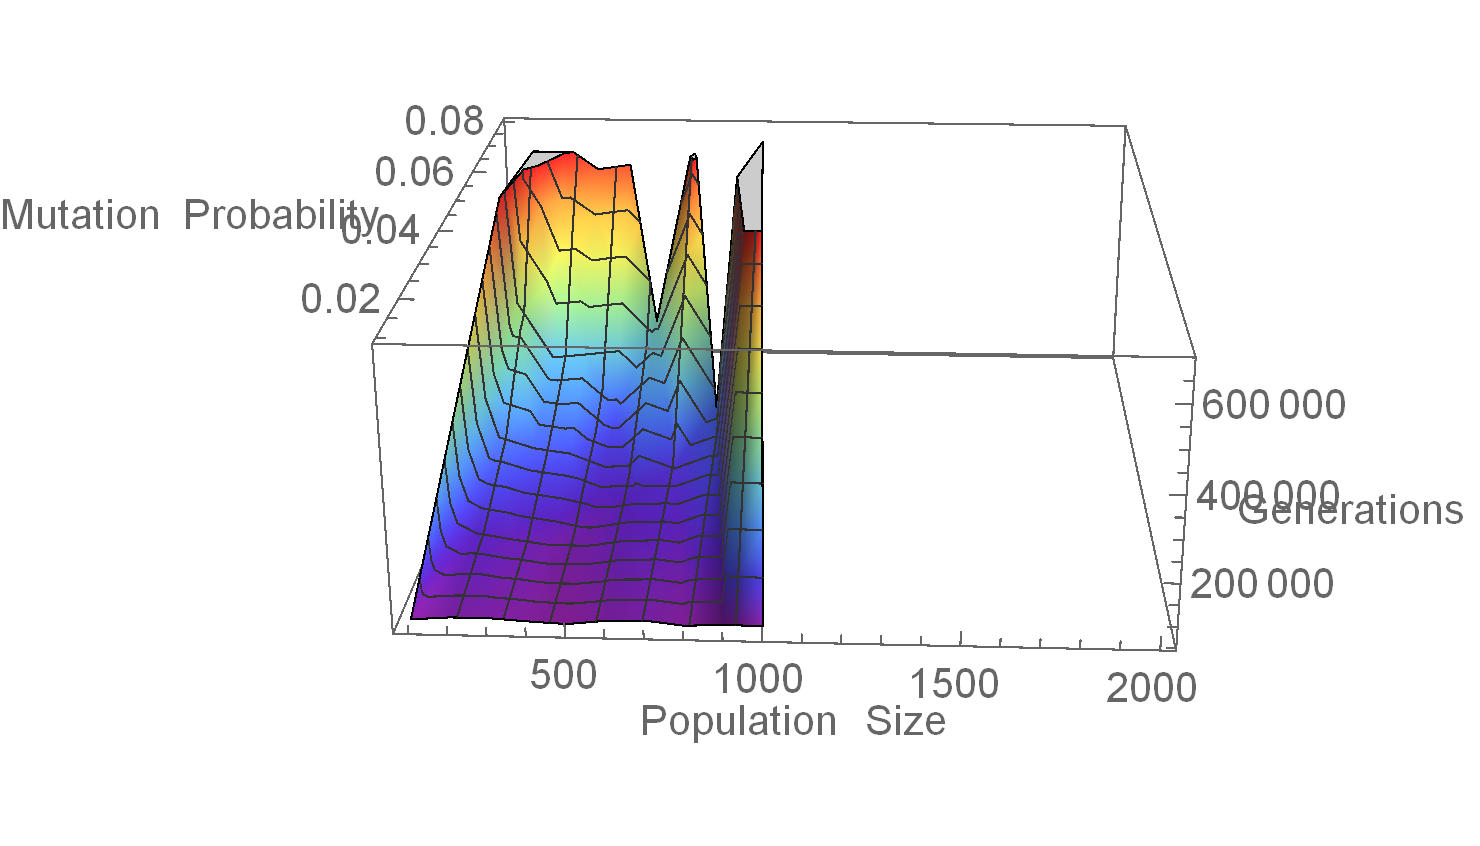
Here is the data and the exact command I'm trying to run.
I've had success with other datasets generated and written out to a file by the exact same program in the exact same manner but for some reason this one won't plot correctly. The only thing I can think of is that it has something to do with the large ranges of the numbers. I can't find any missing commas or otherwise incorrect syntax, however I am very new to mathematica so its likely something very simple I'm overlooking. Played around with PlotRange to no avail. Any Ideas?

ListPlot3D[{{100, 0.01, 60510.1}, {100, 0.015, 70971.5}, {100, 0.02,
   90358.1}, {100, 0.025, 107710}, {100, 0.03, 155191}, {100, 0.035,
   176332}, {100, 0.04, 268286}, {100, 0.045, 387221}, {100, 0.05,
   446528}, {100, 0.055, 616056}, {100, 0.06, 840413}, {100, 0.065,
   1.37393*10^6}, {100, 0.07, 1.36754*10^6}, {100, 0.075,
   2.77176*10^6}, {100, 0.08, 2.426*10^6}, {200, 0.01, 66869.9}, {200,
    0.015, 71399.5}, {200, 0.02, 74329.3}, {200, 0.025,
   99582.5}, {200, 0.03, 121926}, {200, 0.035, 166560}, {200, 0.04,
   186512}, {200, 0.045, 207654}, {200, 0.05, 256898}, {200, 0.055,
   398627}, {200, 0.06, 466594}, {200, 0.065, 662348}, {200, 0.07,
   933421}, {200, 0.075, 1.11269*10^6}, {200, 0.08,
   1.36385*10^6}, {300, 0.01, 67070.1}, {300, 0.015, 65805.3}, {300,
   0.02, 80248.1}, {300, 0.025, 85741.4}, {300, 0.03, 96002.1}, {300,
   0.035, 120096}, {300, 0.04, 159605}, {300, 0.045, 170339}, {300,
   0.05, 228897}, {300, 0.055, 256947}, {300, 0.06, 345085}, {300,
   0.065, 450238}, {300, 0.07, 700978}, {300, 0.075, 832152}, {300,
   0.08, 1.32654*10^6}, {400, 0.01, 61246.9}, {400, 0.015,
   66118}, {400, 0.02, 68661.2}, {400, 0.025, 73570.8}, {400, 0.03,
   92025.9}, {400, 0.035, 109598}, {400, 0.04, 147937}, {400, 0.045,
   161330}, {400, 0.05, 224650}, {400, 0.055, 266217}, {400, 0.06,
   310519}, {400, 0.065, 447822}, {400, 0.07, 641469}, {400, 0.075,
   806530}, {400, 0.08, 1.37741*10^6}, {500, 0.01, 56989.3}, {500,
   0.015, 67928.9}, {500, 0.02, 69761.9}, {500, 0.025, 86710.9}, {500,
    0.03, 79849}, {500, 0.035, 97954.5}, {500, 0.04, 127872}, {500,
   0.045, 139649}, {500, 0.05, 150587}, {500, 0.055, 275188}, {500,
   0.06, 305953}, {500, 0.065, 426897}, {500, 0.07, 654867}, {500,
   0.075, 966621}, {500, 0.08, 1.36171*10^6}, {600, 0.01,
   66711.9}, {600, 0.015, 65131.8}, {600, 0.02, 73614.3}, {600, 0.025,
    78866}, {600, 0.03, 81276.7}, {600, 0.035, 102292}, {600, 0.04,
   107857}, {600, 0.045, 139988}, {600, 0.05, 189010}, {600, 0.055,
   260216}, {600, 0.06, 315841}, {600, 0.065, 440656}, {600, 0.07,
   662428}, {600, 0.075, 985202}, {600, 0.08, 1.51782*10^6}, {700,
   0.01, 69192.1}, {700, 0.015, 66052.4}, {700, 0.02, 72424.6}, {700,
   0.025, 82281.8}, {700, 0.03, 86213}, {700, 0.035, 94029.4}, {700,
   0.04, 114066}, {700, 0.045, 140307}, {700, 0.05, 182638}, {700,
   0.055, 235287}, {700, 0.06, 330950}, {700, 0.065, 474889}, {700,
   0.07, 735568}, {700, 0.075, 1.08146*10^6}, {700, 0.08,
   1.66039*10^6}, {800, 0.01, 58843.3}, {800, 0.015, 64994.5}, {800,
   0.02, 67298.5}, {800, 0.025, 74371.7}, {800, 0.03, 80555.1}, {800,
   0.035, 99640.4}, {800, 0.04, 104818}, {800, 0.045, 143354}, {800,
   0.05, 177583}, {800, 0.055, 245006}, {800, 0.06, 338566}, {800,
   0.065, 499601}, {800, 0.07, 732425}, {800, 0.075,
   1.17749*10^6}, {800, 0.08, 1.88361*10^6}, {900, 0.01,
   63246.3}, {900, 0.015, 64967.4}, {900, 0.02, 67008.1}, {900, 0.025,
    79926.8}, {900, 0.03, 77706.3}, {900, 0.035, 96751.9}, {900, 0.04,
    123840}, {900, 0.045, 133210}, {900, 0.05, 178143}, {900, 0.055,
   254075}, {900, 0.06, 355435}, {900, 0.065, 504921}, {900, 0.07,
   756158}, {900, 0.075, 1.29332*10^6}, {900, 0.08,
   2.01113*10^6}, {1000, 0.01, 61433.1}, {1000, 0.015,
   63099.3}, {1000, 0.02, 66182.8}, {1000, 0.025, 72844.6}, {1000,
   0.03, 85995.2}, {1000, 0.035, 103902}, {1000, 0.04, 109085}, {1000,
    0.045, 138993}, {1000, 0.05, 189084}, {1000, 0.055,
   257315}, {1000, 0.06, 396645}, {1000, 0.065, 539882}, {1000, 0.07,
   778581}, {1000, 0.075, 1.40995*10^6}, {1000, 0.08,
   2.23897*10^6}, {1100, 0.01, 60104.5}, {1100, 0.015,
   64439.1}, {1100, 0.02, 72467.6}, {1100, 0.025, 76612.4}, {1100,
   0.03, 84767.1}, {1100, 0.035, 106206}, {1100, 0.04, 122682}, {1100,
    0.045, 152169}, {1100, 0.05, 198745}, {1100, 0.055,
   259857}, {1100, 0.06, 388296}, {1100, 0.065, 564835}, {1100, 0.07,
   899551}, {1100, 0.075, 1.46177*10^6}, {1100, 0.08,
   2.31448*10^6}, {1200, 0.01, 58711.3}, {1200, 0.015,
   62742.4}, {1200, 0.02, 64179.7}, {1200, 0.025, 73288.1}, {1200,
   0.03, 85146.1}, {1200, 0.035, 96879.7}, {1200, 0.04,
   127671}, {1200, 0.045, 154304}, {1200, 0.05, 201372}, {1200, 0.055,
    278887}, {1200, 0.06, 416279}, {1200, 0.065, 622232}, {1200, 0.07,
    962591}, {1200, 0.075, 1.54832*10^6}, {1200, 0.08,
   2.50081*10^6}, {1300, 0.01, 58959.4}, {1300, 0.015,
   59761.6}, {1300, 0.02, 69075.9}, {1300, 0.025, 70665.1}, {1300,
   0.03, 87007.1}, {1300, 0.035, 105193}, {1300, 0.04, 124706}, {1300,
    0.045, 163178}, {1300, 0.05, 213193}, {1300, 0.055,
   300242}, {1300, 0.06, 432419}, {1300, 0.065, 651916}, {1300, 0.07,
   982562}, {1300, 0.075, 1.67169*10^6}, {1300, 0.08,
   2.57347*10^6}, {1400, 0.01, 57704.8}, {1400, 0.015,
   58191.2}, {1400, 0.02, 66720.6}, {1400, 0.025, 79106.7}, {1400,
   0.03, 88716.8}, {1400, 0.035, 102867}, {1400, 0.04, 126105}, {1400,
    0.045, 165217}, {1400, 0.05, 222163}, {1400, 0.055,
   316881}, {1400, 0.06, 460439}, {1400, 0.065, 660282}, {1400, 0.07,
   1.14617*10^6}, {1400, 0.075, 1.69754*10^6}, {1400, 0.08,
   2.6663*10^6}, {1500, 0.01, 59764.7}, {1500, 0.015, 62215.2}, {1500,
    0.02, 65577.2}, {1500, 0.025, 76682.2}, {1500, 0.03,
   86029.3}, {1500, 0.035, 112143}, {1500, 0.04, 137974}, {1500,
   0.045, 172846}, {1500, 0.05, 239260}, {1500, 0.055, 341533}, {1500,
    0.06, 485092}, {1500, 0.065, 753040}, {1500, 0.07,
   1.16581*10^6}, {1500, 0.075, 1.86748*10^6}, {1500, 0.08,
   3.00517*10^6}, {1600, 0.01, 62543.2}, {1600, 0.015,
   64851.5}, {1600, 0.02, 65456.3}, {1600, 0.025, 78520.7}, {1600,
   0.03, 87927.6}, {1600, 0.035, 109371}, {1600, 0.04, 137308}, {1600,
    0.045, 181338}, {1600, 0.05, 247086}, {1600, 0.055,
   362190}, {1600, 0.06, 500233}, {1600, 0.065, 756103}, {1600, 0.07,
   1.17895*10^6}, {1600, 0.075, 1.94942*10^6}, {1600, 0.08,
   2.93227*10^6}, {1700, 0.01, 60449.8}, {1700, 0.015,
   63595.8}, {1700, 0.02, 65236.4}, {1700, 0.025, 77964}, {1700, 0.03,
    92225.1}, {1700, 0.035, 112889}, {1700, 0.04, 142803}, {1700,
   0.045, 184930}, {1700, 0.05, 269727}, {1700, 0.055, 362958}, {1700,
    0.06, 540865}, {1700, 0.065, 780493}, {1700, 0.07,
   1.26828*10^6}, {1700, 0.075, 2.0631*10^6}, {1700, 0.08,
   3.2993*10^6}, {1800, 0.01, 58425.4}, {1800, 0.015, 62231.2}, {1800,
    0.02, 69519.5}, {1800, 0.025, 80873.6}, {1800, 0.03,
   98030.4}, {1800, 0.035, 115355}, {1800, 0.04, 147563}, {1800,
   0.045, 203516}, {1800, 0.05, 268480}, {1800, 0.055, 390830}, {1800,
    0.06, 567131}, {1800, 0.065, 885360}, {1800, 0.07,
   1.34411*10^6}, {1800, 0.075, 2.13143*10^6}, {1800, 0.08,
   3.22582*10^6}, {1900, 0.01, 57286.1}, {1900, 0.015,
   63730.3}, {1900, 0.02, 72297.1}, {1900, 0.025, 81728.8}, {1900,
   0.03, 99080.2}, {1900, 0.035, 123071}, {1900, 0.04, 152708}, {1900,
    0.045, 205180}, {1900, 0.05, 273948}, {1900, 0.055,
   403890}, {1900, 0.06, 591449}, {1900, 0.065, 917536}, {1900, 0.07,
   1.3526*10^6}, {1900, 0.075, 2.21305*10^6}, {1900, 0.08,
   3.38519*10^6}, {2000, 0.01, 59740.3}, {2000, 0.015,
   65435.7}, {2000, 0.02, 73929.5}, {2000, 0.025, 90775.2}, {2000,
   0.03, 100335}, {2000, 0.035, 124159}, {2000, 0.04, 159627}, {2000,
   0.045, 214404}, {2000, 0.05, 300085}, {2000, 0.055, 422780}, {2000,
    0.06, 602504}, {2000, 0.065, 924957}, {2000, 0.07,
   1.44754*10^6}, {2000, 0.075, 2.29632*10^6}, {2000, 0.08,
   3.55013*10^6}},
 AxesLabel -> {Population Size, Mutation Probability, Generations},
 ColorFunction -> "Rainbow"]


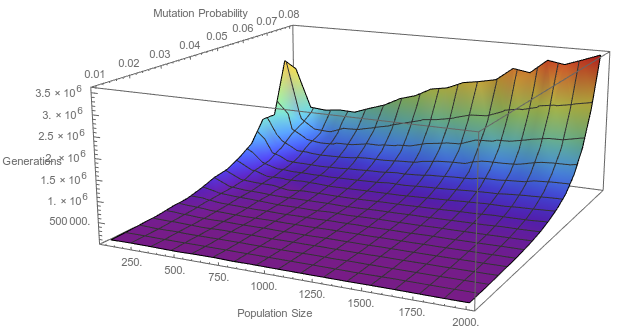
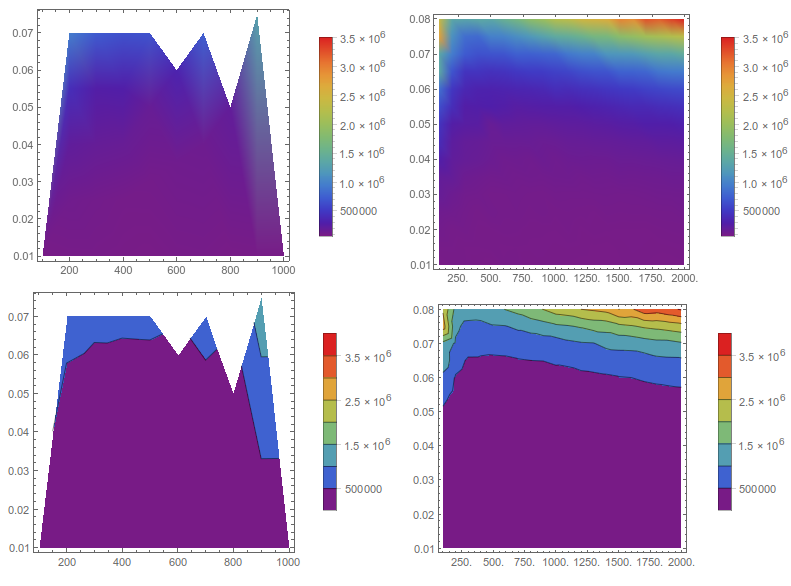
ListPlot3D[Transpose@Partition[Last /@ data, 15], DataRange -> {{100, 2000}, {0.01, 0.08}}, PlotRange -> All, ColorFunction -> "Rainbow"]i.sstatic.net/mwQmc.png $\endgroup$ListPointPlot3Dapplied to the original data works properly, although it does not have the desired appearance. Interestingly, settingInterpolationOrder -> 0inListPlot3Dalso plots the entire range, but the output is wrong! Evidently,ListPlot3Dcannot handle data with such an enormous range of variation. $\endgroup$data[[All,2]] *= 100), or the population in thousands. $\endgroup$