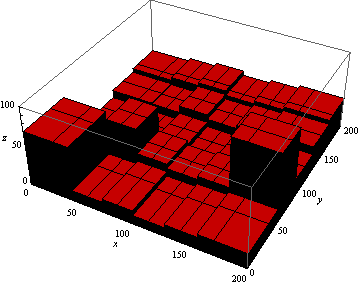
The data I have given here will plot the data in ListPlot3D function and gives the visualization of bars on the plot.
I want to customize the color for the bars in the plot. I need to plot them in two colors — one for side of the bar and another for the top surface of the bar. How can I set the color function to achieve this?
finalData = {{14.38, 18.1, 70}, {14.385714285714286`, 54.`,
70}, {42.857142857142854`, 18.1`, 70}, {42.857142857142854`, 54.`,
 70}, {14.385714285714286`, 54.1`, 20}, {14.385714285714286`,
90.`, 20}, {42.857142857142854`, 54.1`, 20}, {42.857142857142854`,
 90.`, 20}, {14.385714285714286`, 90.1`,
15}, {14.385714285714286`, 126.`, 15}, {42.857142857142854`,
90.1`, 15}, {42.857142857142854`, 126.`,
15}, {14.385714285714286`, 126.1`, 25}, {14.385714285714286`,
162.`, 25}, {42.857142857142854`, 126.1`,
25}, {42.857142857142854`, 162.`, 25}, {14.385714285714286`,
162.1`, 30}, {14.385714285714286`, 180, 30}, {42.857142857142854`,
 162.1`, 30}, {42.857142857142854`, 180,
30}, {42.957142857142856`, 18.1`, 14}, {42.957142857142856`, 54.`,
 14}, {71.42857142857143`, 18.1`, 14}, {71.42857142857143`, 54.`,
14}, {42.957142857142856`, 54.1`, 60}, {42.957142857142856`, 90.`,
 60}, {71.42857142857143`, 54.1`, 60}, {71.42857142857143`, 90.`,
60}, {42.957142857142856`, 90.1`, 14}, {42.957142857142856`,
126.`, 14}, {71.42857142857143`, 90.1`, 14}, {71.42857142857143`,
126.`, 14}, {42.957142857142856`, 126.1`,
24}, {42.957142857142856`, 162.`, 24}, {71.42857142857143`,
126.1`, 24}, {71.42857142857143`, 162.`,
24}, {42.957142857142856`, 162.1`, 34}, {42.957142857142856`, 180,
 34}, {71.42857142857143`, 162.1`, 34}, {71.42857142857143`, 180,
34}, {71.52857142857142`, 18.1`, 18}, {71.52857142857142`, 54.`,
18}, {100.`, 18.1`, 18}, {100.`, 54.`, 18}, {71.52857142857142`,
54.1`, 28}, {71.52857142857142`, 90.`, 28}, {100.`, 54.1`,
28}, {100.`, 90.`, 28}, {71.52857142857142`, 90.1`,
23}, {71.52857142857142`, 126.`, 23}, {100.`, 90.1`, 23}, {100.`,
126.`, 23}, {71.52857142857142`, 126.1`, 33}, {71.52857142857142`,
 162.`, 33}, {100.`, 126.1`, 33}, {100.`, 162.`,
33}, {71.52857142857142`, 162.1`, 38}, {71.52857142857142`, 180,
38}, {100.`, 162.1`, 38}, {100.`, 180, 38}, {100.1`, 18.1`,
12}, {100.1`, 54.`, 12}, {128.57142857142858`, 18.1`,
12}, {128.57142857142858`, 54.`, 12}, {100.1`, 54.1`,
22}, {100.1`, 90.`, 22}, {128.57142857142858`, 54.1`,
22}, {128.57142857142858`, 90.`, 22}, {100.1`, 90.1`,
17}, {100.1`, 126.`, 17}, {128.57142857142858`, 90.1`,
17}, {128.57142857142858`, 126.`, 17}, {100.1`, 126.1`,
27}, {100.1`, 162.`, 27}, {128.57142857142858`, 126.1`,
27}, {128.57142857142858`, 162.`, 27}, {100.1`, 162.1`,
32}, {100.1`, 180, 32}, {128.57142857142858`, 162.1`,
32}, {128.57142857142858`, 180, 32}, {128.67142857142858`, 18.1`,
16}, {128.67142857142858`, 54.`, 16}, {157.14285714285714`, 18.1`,
 16}, {157.14285714285714`, 54.`, 16}, {128.67142857142858`,
54.1`, 26}, {128.67142857142858`, 90.`, 26}, {157.14285714285714`,
 54.1`, 26}, {157.14285714285714`, 90.`,
26}, {128.67142857142858`, 90.1`, 21}, {128.67142857142858`,
126.`, 21}, {157.14285714285714`, 90.1`,
21}, {157.14285714285714`, 126.`, 21}, {128.67142857142858`,
126.1`, 31}, {128.67142857142858`, 162.`,
31}, {157.14285714285714`, 126.1`, 31}, {157.14285714285714`,
162.`, 31}, {128.67142857142858`, 162.1`,
36}, {128.67142857142858`, 180, 36}, {157.14285714285714`, 162.1`,
 36}, {157.14285714285714`, 180, 36}, {157.24285714285713`, 18.1`,
 20}, {157.24285714285713`, 54.`, 20}, {185.71428571428572`,
18.1`, 20}, {185.71428571428572`, 54.`, 20}, {157.24285714285713`,
 54.1`, 90}, {157.24285714285713`, 90.`,
90}, {185.71428571428572`, 54.1`, 90}, {185.71428571428572`, 90.`,
 90}, {157.24285714285713`, 90.1`, 25}, {157.24285714285713`,
126.`, 25}, {185.71428571428572`, 90.1`,
25}, {185.71428571428572`, 126.`, 25}, {157.24285714285713`,
126.1`, 35}, {157.24285714285713`, 162.`,
35}, {185.71428571428572`, 126.1`, 35}, {185.71428571428572`,
162.`, 35}, {157.24285714285713`, 162.1`,
40}, {157.24285714285713`, 180, 40}, {185.71428571428572`, 162.1`,
 40}, {185.71428571428572`, 180, 40}};
ListPlot3D[finalData, Filling -> Bottom, RotationAction -> "Clip",AxesLabel -> {x, y, z}, PlotRange -> {{0, 200}, {0, 200}, {0, 100}}]

