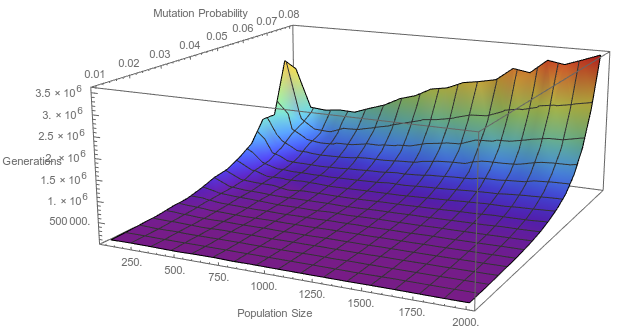
As stated in the comments, this problem has to do with the fact that the different axes have wildly different scales. See the questions here and here for a discussion on this.
@Rahul gave a workaround that is specific to the case where the data is on a rectangular grid,
ListPlot3D[Transpose@Partition[Last /@ data, 15],
 DataRange -> {{100, 2000}, {0.01, 0.08}}, PlotRange -> All,
 ColorFunction -> "Rainbow"]

But we can make another workaround for the case where the data is even on an unstructured grid. The idea is to rescale the data before plotting, and then rescale the tick marks so as to match the original data ranges using the CustomTicks package.
Needs["CustomTicks`"];
rescaleListPlot3D[data_, plotopts : OptionsPattern[ListPlot3D]] :=
 Module[{rescaleddata},
  rescaleddata =
   Transpose[Rescale[#, MinMax@#] & /@ Transpose[data]];
  ListPlot3D[rescaleddata,
   Ticks ->
    Function[mm,
      LinTicks[Sequence @@ mm,
       TickPostTransformation -> (Rescale[#, mm, {0, 1}] &),
       TickLabelFunction -> (N@# &)]] /@ (MinMax /@ Transpose[data]),
   plotopts]
  ]

rescaleListPlot3D[data, PlotRange -> All,
 AxesLabel -> {Population Size, Mutation Probability, Generations},
 ColorFunction -> "Rainbow"]

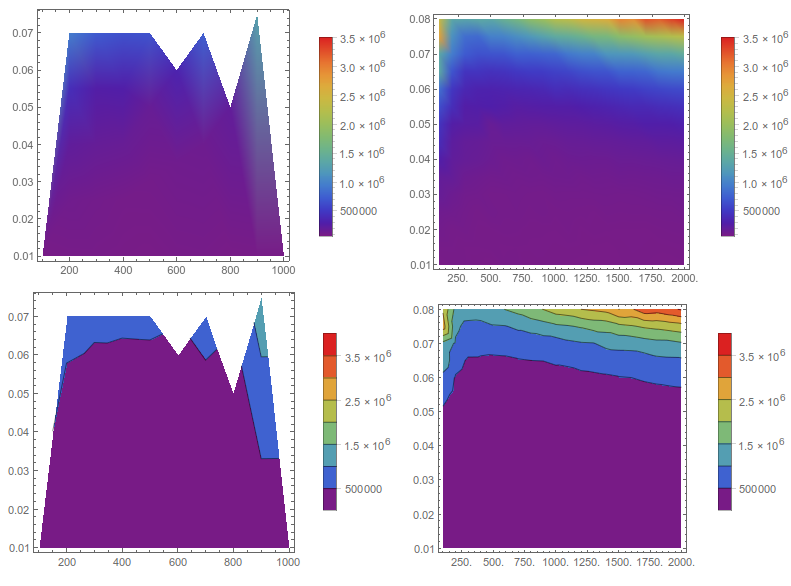
And we can make a contour and density plot version, since these also suffer from the same interpolation problems,
rescaleListDensityPlot[data_,
   plotopts : OptionsPattern[ListDensityPlot]] :=
  Module[{rescaleddata},
   rescaleddata = data;
   rescaleddata[[All, ;; 2]] =
    Transpose[
     Rescale[#, MinMax@#] & /@ Transpose[data[[All, ;; 2]]]];
   ListDensityPlot[rescaleddata, plotopts,
    FrameTicks ->
     (Function[mm,
        {LinTicks[Sequence @@ mm,
          TickPostTransformation -> (Rescale[#, mm, {0, 1}] &),
          TickLabelFunction -> (N@# &)],
         StripTickLabels[
          LinTicks[Sequence @@ mm,
           TickPostTransformation -> (Rescale[#, mm, {0, 1}] &),
           TickLabelFunction -> (N@# &)]]}] /@ (MinMax /@
         Transpose[data[[All, {2, 1}]]]))]
   ];
rescaleListContourPlot[data_,
  plotopts : OptionsPattern[ListContourPlot]] := Module[{rescaleddata},
  rescaleddata = data;
  rescaleddata[[All, ;; 2]] =
   Transpose[Rescale[#, MinMax@#] & /@ Transpose[data[[All, ;; 2]]]];
  ListContourPlot[rescaleddata, plotopts,
   FrameTicks ->
    (Function[mm,
       {LinTicks[Sequence @@ mm,
         TickPostTransformation -> (Rescale[#, mm, {0, 1}] &),
         TickLabelFunction -> (N@# &)],
        StripTickLabels[
         LinTicks[Sequence @@ mm,
          TickPostTransformation -> (Rescale[#, mm, {0, 1}] &),
          TickLabelFunction -> (N@# &)]]}] /@ (MinMax /@
        Transpose[data[[All, {2, 1}]]]))]
  ];
and compare the results of plotting with and without the rescaling.
Grid[{
  {ListDensityPlot[data, ColorFunction -> "Rainbow", PlotRange -> All,
     PlotLegends -> Automatic],
   rescaleListDensityPlot[data, ColorFunction -> "Rainbow",
    PlotRange -> All, PlotLegends -> Automatic]},
  {ListContourPlot[data, ColorFunction -> "Rainbow", PlotRange -> All,
     PlotLegends -> Automatic],
   rescaleListContourPlot[data, ColorFunction -> "Rainbow",
    PlotRange -> All, PlotLegends -> Automatic]
   }}]


