10
$\begingroup$

I am working with a function in Mathematica and I am getting some inconsistencies when I plot it. As I really need to understand were this comes from I would appreciate any help.

I am working with a function of the following form:

f2b[b_] = Exp[-1000 - 2 Sqrt[1000*b] - b]*(Erfi[Sqrt[1000]] - Erfi[Sqrt[1000] + Sqrt[b]])

From my understanding this function should go to zero for very small b because both parts, the Exp function as well as the difference between the imaginary error functions, should vanish.

Mathematica calculates:

f2b[E^-30] // N = -3.4517046881*10^-7 as expected.

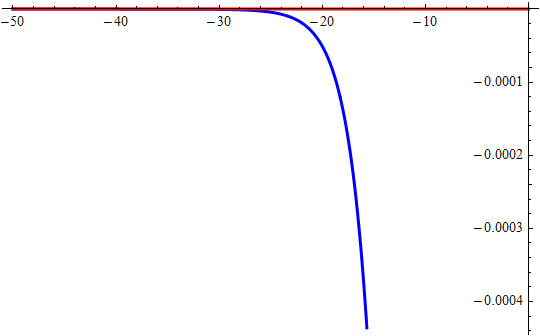
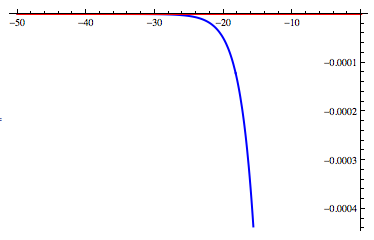
BUT if I plot this function:

Plot[{f2b[E^b], 0}, {b, -50, 0}, PlotStyle -> {{Blue, Thick}, {Red, Thick}}]
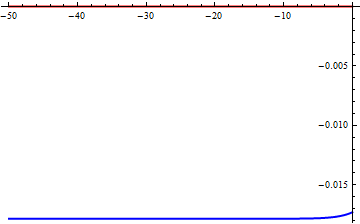
Mathematica graphics

Mathematica shows me a plot which is approaching a value of about -0.0175 for small b and has therefore an absolute value much larger the the value at E^-30 calculated above.

If I tabulate, interpolate and plot the function:

t = Table[{b, f2b[E^b] // N}, {b, -50, 0}]; f = Interpolation[t]; Plot[{f[b], 0}, {b, -50, 0}, PlotStyle -> {{Blue, Thick}, {Red, Thick}}]
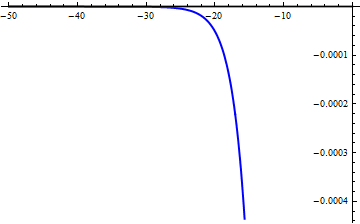
Mathematica graphics

The plot is looking much different and is approaching zero as expected.

I am wondering whether this has to do something with overflow problems in graphics but I am not sure.

$\endgroup$
0

3 Answers 3

7
$\begingroup$

Your function isn't evaluating correctly when given inexact input:

In[16]:= Table[f2b[N[E^-k]], {k, 0, 50, 10}]

Out[16]= {-0.01730248257001, -0.01784636881283, -0.01785014954397,
          -0.01785017502377, -0.01785017519545, -0.01785017519660}

If we force f2b to be evaluated with exact inputs (delaying the numericization of the result) we get the expected plot:

f2b2[b_?NumericQ] := N[f2b[SetPrecision[b, Infinity]]] 

Plot[{f2b2[E^b], 0}, {b, -50, 0}, PlotStyle -> {{Blue, Thick}, {Red, Thick}}]

enter image description here

$\endgroup$
1
  • $\begingroup$ Thank you for your help; the answer by Brett Champion solves my problem! I tried to increase the WorkingPrecision earlier which did not work. Thank You! Silky $\endgroup$
    – silky
    Commented Jun 20, 2012 at 14:01
4
$\begingroup$

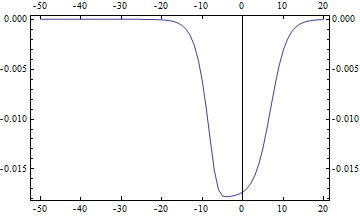
Keeping exact values until the last moment yields this:

f2b[b_] := 
 Exp[-1000 - 2 Sqrt[1000*b] - b]*(Erfi[Sqrt[1000]] - 
    Erfi[Sqrt[1000] + Sqrt[b]]);

ticks = Transpose[{Range[8]*10 - 9, Table[x, {x, -50, 20, 10}]}];

Show[ListLinePlot[Table[N[f2b[E^x]], {x, -50, 20}], Frame -> True,
  FrameTicks -> {{All, All}, {ticks, ticks}}],
 Graphics[Style[Line[{{51, 0}, {51, -1}}], Antialiasing -> False]]]

enter image description here

$\endgroup$
1
  • 1
    $\begingroup$ +1. N is superfluous in your code since ListLinePlot will apply N automatically (see the InputForm of ListLinePlot with exact values). $\endgroup$ Commented Jun 20, 2012 at 14:39
3
$\begingroup$

Another alternative is to set WorkingPrecision to Infinity:

f2b[b_?NumericQ]:=Exp[-1000-2 Sqrt[1000*b]-b]*(Erfi[Sqrt[1000]]-Erfi[Sqrt[1000]+Sqrt[b]])
Plot[{f2b[E^b],0},{b,-50,0},PlotStyle->{{Blue,Thick},{Red,Thick}},WorkingPrecision->Infinity]

plot

The above works but it is quite strange that setting WorkingPrecision to a value more than 150 results in a very long evaluation giving wrong result.

$\endgroup$

Your Answer

By clicking “Post Your Answer”, you agree to our terms of service and acknowledge you have read our privacy policy.

Not the answer you're looking for? Browse other questions tagged or ask your own question.