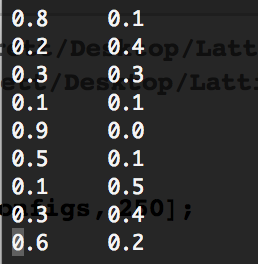
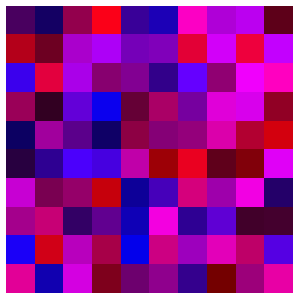
I am looking to plot a line of 250 discrete sites with a specified RGB color value based on the import file values. The import file has the following format:
I want the first element in each row to be the blue color value, and the 2nd element to be the red color value. For, example, the color of the first site would be (0.8, 0, 0.1) using RGB color.
I am trying to use MatrixPlot with the color function, but I can't seem to get it working. I cant seem to get the color function to line up with each site, and loop through all of the sites. I have a simple model up and running where the import file is just 1 column of 0,1,2 with 0=white, 1=red,2=blue, and looks like
I just can't seem to figure out how to do matrix plot for each site using the RGB value plot based on 2 values.


