edited tags
Link
Alexey Popkov
  • 62.3k
  • 7
  • 154
  • 375
added 96 characters in body
Source Link
Sjoerd C. de Vries
  • 66.1k
  • 15
  • 189
  • 327

I am working with a function in Mathematica and I am getting some inconsistencies when I plot it. As I really need to understand were this comes from I would appreciate any help.

I am working with a function of the following form:

f2b[b_] = Exp[-1000 - 2 Sqrt[1000*b] - b]*(Erfi[Sqrt[1000]] - Erfi[Sqrt[1000] + Sqrt[b]])

From my understanding this function should go to zero for very small b because both parts, the Exp function as well as the difference between the imaginary error functions, should vanish.

Mathematica calculates:

f2b[E^-30] // N = -3.4517046881*10^-7 as expected.

BUT if I plot this function:

Plot[{f2b[E^b], 0}, {b, -50, 0}, PlotStyle -> {{Blue, Thick}, {Red, Thick}}]
Mathematica graphics

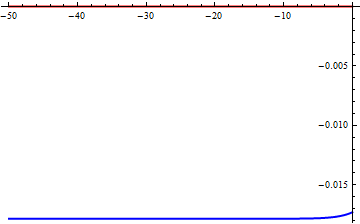
Mathematica shows me a plot which is approaching a value of about -0.0175 for small b and has therefore an absolute value much larger the the value at E^-30 calculated above.

If I tabulate, interpolate and plot the function:

t = Table[{b, f2b[E^b] // N}, {b, -50, 0}]; f = Interpolation[t]; Plot[{f[b], 0}, {b, -50, 0}, PlotStyle -> {{Blue, Thick}, {Red, Thick}}]
Mathematica graphics

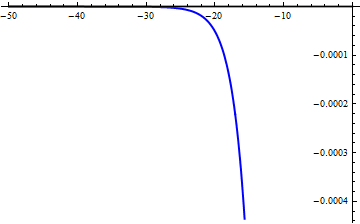
The plot is looking much different and is approaching zero as expected.

I am wondering whether this has to do something with overflow problems in graphics but I am not sure.

Thanks in advance.

Silky

I am working with a function in Mathematica and I am getting some inconsistencies when I plot it. As I really need to understand were this comes from I would appreciate any help.

I am working with a function of the following form:

f2b[b_] = Exp[-1000 - 2 Sqrt[1000*b] - b]*(Erfi[Sqrt[1000]] - Erfi[Sqrt[1000] + Sqrt[b]])

From my understanding this function should go to zero for very small b because both parts, the Exp function as well as the difference between the imaginary error functions, should vanish.

Mathematica calculates:

f2b[E^-30] // N = -3.4517046881*10^-7 as expected.

BUT if I plot this function:

Plot[{f2b[E^b], 0}, {b, -50, 0}, PlotStyle -> {{Blue, Thick}, {Red, Thick}}]

Mathematica shows me a plot which is approaching a value of about -0.0175 for small b and has therefore an absolute value much larger the the value at E^-30 calculated above.

If I tabulate, interpolate and plot the function:

t = Table[{b, f2b[E^b] // N}, {b, -50, 0}]; f = Interpolation[t]; Plot[{f[b], 0}, {b, -50, 0}, PlotStyle -> {{Blue, Thick}, {Red, Thick}}]

The plot is looking much different and is approaching zero as expected.

I am wondering whether this has to do something with overflow problems in graphics but I am not sure.

Thanks in advance.

Silky

I am working with a function in Mathematica and I am getting some inconsistencies when I plot it. As I really need to understand were this comes from I would appreciate any help.

I am working with a function of the following form:

f2b[b_] = Exp[-1000 - 2 Sqrt[1000*b] - b]*(Erfi[Sqrt[1000]] - Erfi[Sqrt[1000] + Sqrt[b]])

From my understanding this function should go to zero for very small b because both parts, the Exp function as well as the difference between the imaginary error functions, should vanish.

Mathematica calculates:

f2b[E^-30] // N = -3.4517046881*10^-7 as expected.

BUT if I plot this function:

Plot[{f2b[E^b], 0}, {b, -50, 0}, PlotStyle -> {{Blue, Thick}, {Red, Thick}}]

Mathematica graphics

Mathematica shows me a plot which is approaching a value of about -0.0175 for small b and has therefore an absolute value much larger the the value at E^-30 calculated above.

If I tabulate, interpolate and plot the function:

t = Table[{b, f2b[E^b] // N}, {b, -50, 0}]; f = Interpolation[t]; Plot[{f[b], 0}, {b, -50, 0}, PlotStyle -> {{Blue, Thick}, {Red, Thick}}]

Mathematica graphics

The plot is looking much different and is approaching zero as expected.

I am wondering whether this has to do something with overflow problems in graphics but I am not sure.

Post Migrated Here from stackoverflow.com (revisions)
Source Link
silky
  • 103
  • 3

Mathematica Plot: Inconsistency when plotting large values

I am working with a function in Mathematica and I am getting some inconsistencies when I plot it. As I really need to understand were this comes from I would appreciate any help.

I am working with a function of the following form:

f2b[b_] = Exp[-1000 - 2 Sqrt[1000*b] - b]*(Erfi[Sqrt[1000]] - Erfi[Sqrt[1000] + Sqrt[b]])

From my understanding this function should go to zero for very small b because both parts, the Exp function as well as the difference between the imaginary error functions, should vanish.

Mathematica calculates:

f2b[E^-30] // N = -3.4517046881*10^-7 as expected.

BUT if I plot this function:

Plot[{f2b[E^b], 0}, {b, -50, 0}, PlotStyle -> {{Blue, Thick}, {Red, Thick}}]

Mathematica shows me a plot which is approaching a value of about -0.0175 for small b and has therefore an absolute value much larger the the value at E^-30 calculated above.

If I tabulate, interpolate and plot the function:

t = Table[{b, f2b[E^b] // N}, {b, -50, 0}]; f = Interpolation[t]; Plot[{f[b], 0}, {b, -50, 0}, PlotStyle -> {{Blue, Thick}, {Red, Thick}}]

The plot is looking much different and is approaching zero as expected.

I am wondering whether this has to do something with overflow problems in graphics but I am not sure.

Thanks in advance.

Silky