Today, I was doing my physics homework. One of the questions was to draw velocity-time and position-time graphs from the acceleration-time graph. So for the first step I draw acceleration-time using Graphics:
a = Plot[{10}, {x, 0, 24}, PlotRange -> {{0, 25}, {7, -3}}]
Show[a, Graphics[{Red, Line[{{0, 0}, {2, 0}}]}],
Graphics[{Red, Line[{{2, -2}, {6, -2}}]}],
Graphics[{Red, Line[{{6, 6}, {10, 6}}]}],
Graphics[{Red, Line[{{10, -2}, {22, -2}}]}],
Graphics[{Red, Line[{{22, 0}, {24, 0}}]}],
Graphics[{Black, Dashed, Line[{{2, 0}, {2, -3}}]}],
Graphics[{Black, Dashed, Line[{{6, 6}, {6, -3}}]}],
Graphics[{Black, Dashed, Line[{{10, 6}, {10, -3}}]}],
Graphics[{Black, Dashed, Line[{{22, -3}, {22, 0}}]}],
Graphics[{Black, Dashed, Line[{{24, -3}, {24, 0}}]}]]
And here is the picture of it: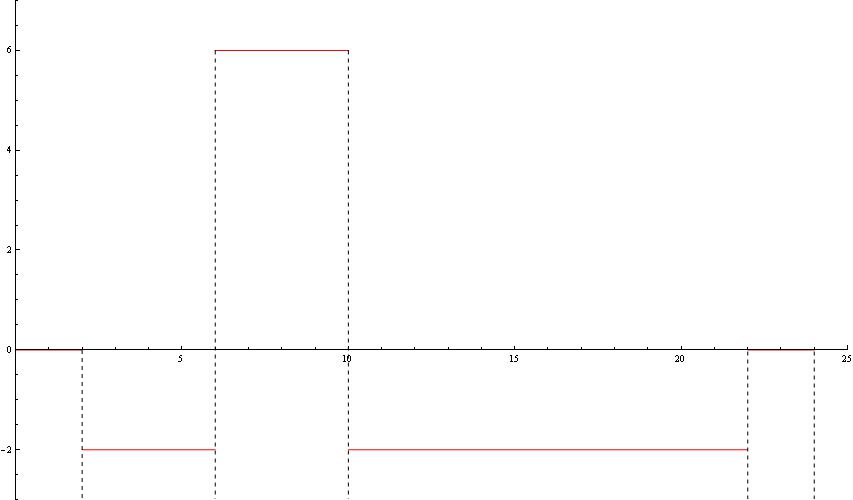
As the question gives us the value of speed in $v_0=3$, I drew it like the previous one (did the calculation on paper):
b = Plot[{100}, {x, 0, 24}, PlotRange -> {{0, 25}, {20, -6}}]
Show[b, Graphics[{Red, Line[{{0, 3}, {2, 3}}]}],
Graphics[{Red, Line[{{2, 3}, {6, -5}}]}],
Graphics[{Red, Line[{{6, -5}, {10, 19}}]}],
Graphics[{Red, Line[{{10, 19}, {22, -5}}]}],
Graphics[{Red, Line[{{22, -5}, {24, -5}}]}],
Graphics[{Black, Dashed, Line[{{2, -6}, {2, 20}}]}],
Graphics[{Black, Dashed, Line[{{6, -6}, {6, 20}}]}],
Graphics[{Black, Dashed, Line[{{10, -6}, {10, 20}}]}],
Graphics[{Black, Dashed, Line[{{22, -6}, {22, 20}}]}],
Graphics[{Black, Dashed, Line[{{24, -6}, {24, 20}}]}],
Graphics[{Black, Dashed,
Line[{{2 + (-3/-2), 0}, {2 + (-3/-2), -6}}]}],
Graphics[{Black, Dashed, Line[{{6 + (5/6), 0}, {6 + (5/6), -6}}]}],
Graphics[{Black, Dashed,
Line[{{10 + (-19/-2), 0}, {10 + (-19/-2), -6}}]}]]
And the result:
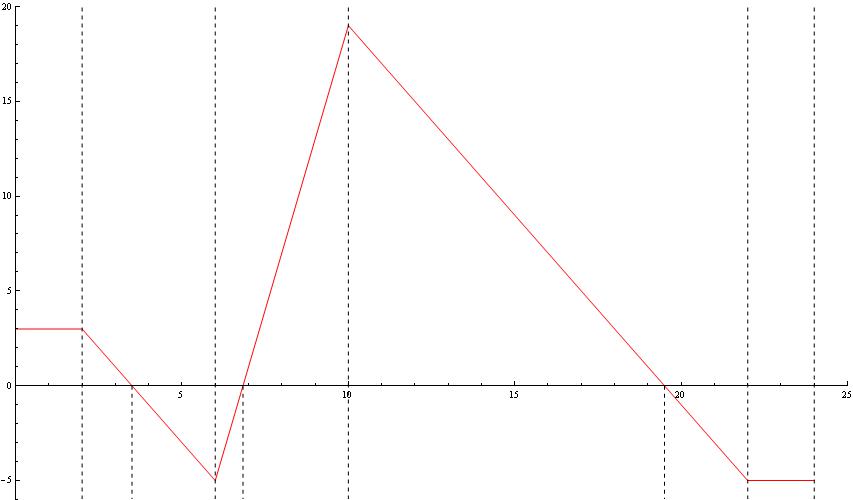
but I was not able to draw position-time, because in most of the time intervals, the shape of the position-time graph is a parabola, which Graphics does not have (as a built-in function).
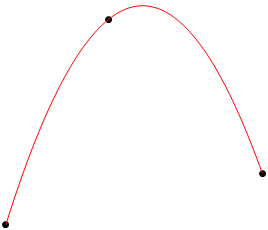
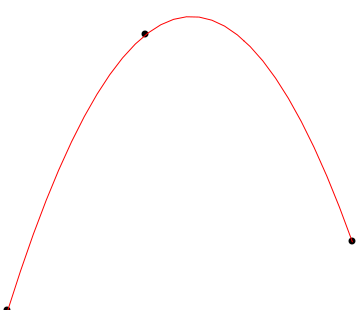
So I want to know how I can write a function that draws a parabola given by 3 points (parabola minimum or maximum point, and two other points where the parabola starts and ends).


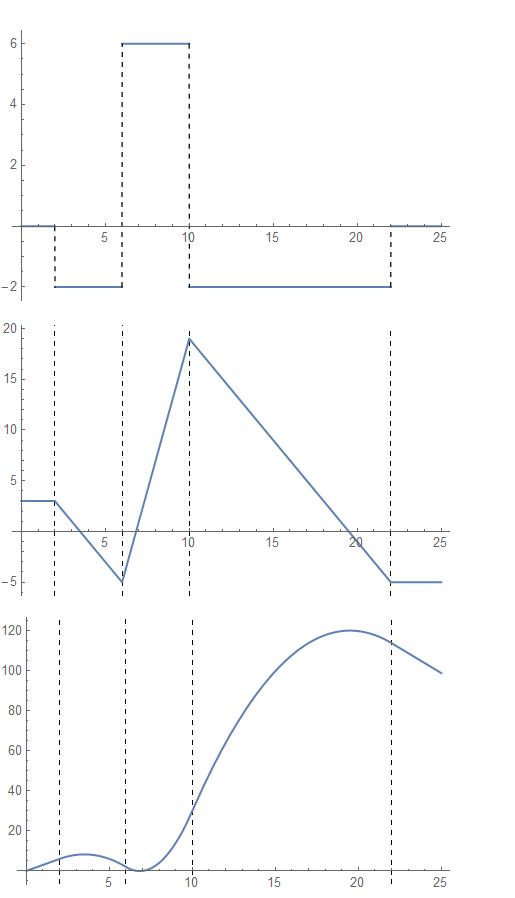

Graphicsinstead of just usingPlot? Seems you are making this harder than it has to be. $\endgroup$Plotor aTableto generate your values. Note: you can also pack all graphics primitives (Lineetc.) into a singleGraphicscall to make the code cleaner. As for integrating, that would be directly related to the physics. $\endgroup$