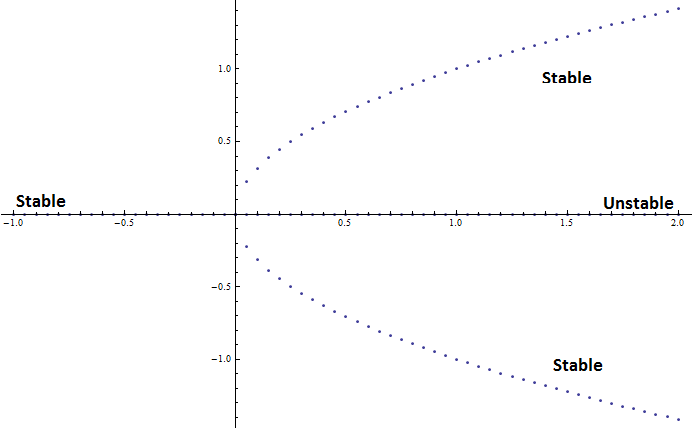
I have the following Pitchfork bifurcation:
f[x_, r_] := r x - x^3
I was able to find some nice code on this site to draw up the Logistic Map.
I have the following snippet (maybe there is a better solution) to draw the bifurcation diagram, but was wondering if it can be colored to represent the stable from unstable branches? ( saved the file, then modified it). We have three stable branches and one unstable branch. The unstable branch is [0, +r], see:

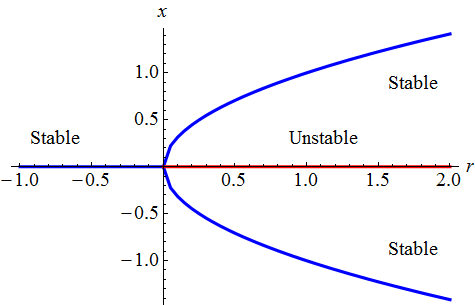
Is there a way to show the three branches as a solid blue line and the unstable branch as a dashed red line? Also, can we label the axes as $r$ and $x$, and the branches as stable and unstable?
Here is the code snippet that drew the above bifurcation diagram (is there an easier way).
   CClear[NotComplexQ];
   NotComplexQ[c_Complex] := False;
   NotComplexQ[c_] := True

  CartProd[l_] := Outer[List, l[[1]], l[[2]]]

  ArreglaLista[l_] := Select[Map[(x /. #) &, Flatten[l]], NotComplexQ]

 Points = Flatten[
   Map[CartProd,
   Table[{{r}, ArreglaLista[NSolve[f[x, r] == 0, x]]}, {r, -1, 2,
   0.05}]], 2]

 ListPlot[Points]

