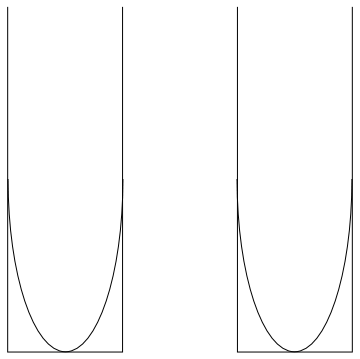
Graphics[{Line[{{0, 3}, {0, 0}, {1, 0}, {1, 3}}], Line[{{2, 3}, {2, 0}, {3, 0}, {3, 3}}]}]
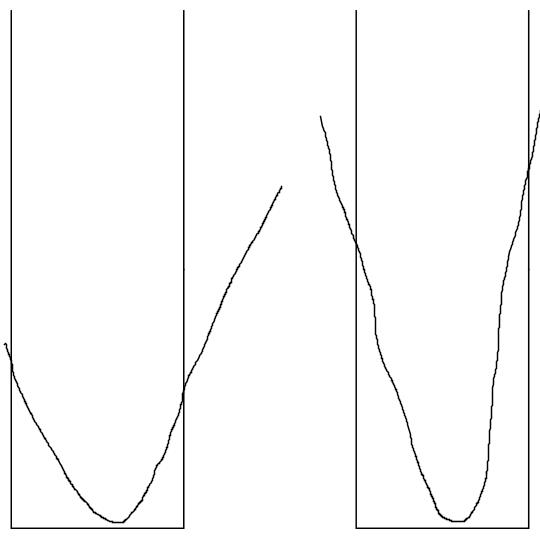
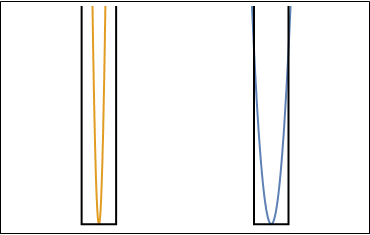
However, I want the output like this:

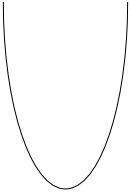
Parabola of different width inside the two boxes. There are previous posts on similar questions. I can draw the first parabola, but not the second one. In fact, I do not understand that answer fully.


Showand addPlotwith your parabola. $\endgroup$