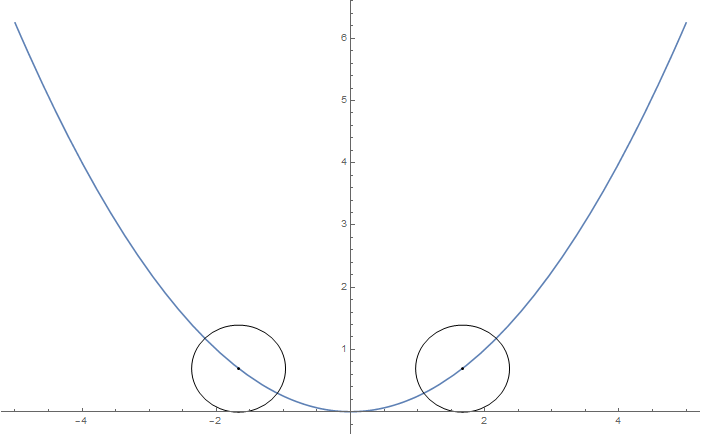
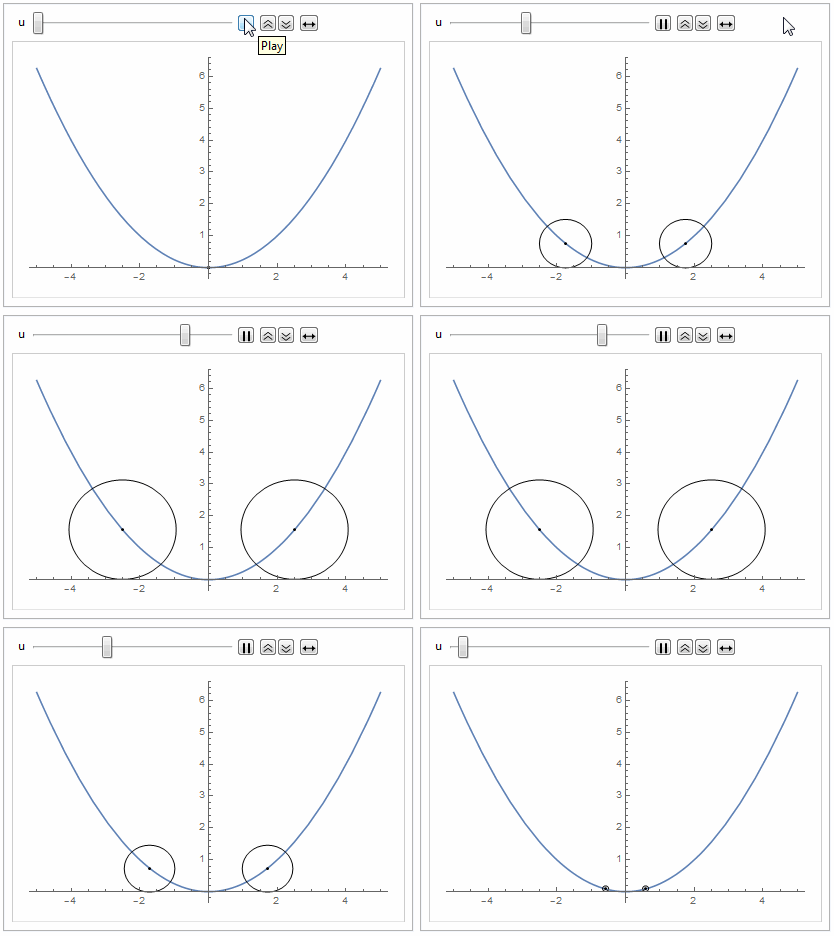
I have the following code:
g[u_,p_] = Graphics{
                    Circle[{2 Sqrt[u], u}, u],
                    Circle[{-2 Sqrt[u], u}, u],
                    Point[{2 Sqrt[u], u}],
                    Point[{-2 Sqrt[u], u}],
                    Inset[p,{0,1},{0,0},{15,10}]
                   }
and I want to draw the parabola that goes through the centers of both of these circles, for every $u \neq 0$ with its value in $0$ equal to $1$. We can see that, if we let $y$ to be the needed curve, that $y(2\sqrt{u}) = u, \forall u \neq 0$ and $y(0) = 1$. By making $u:= u^2$, we see that $y(2u) = u^2$, so by making again $u := u/2$ we see that $y(u) = u^2/4,$ and we also need to subtract one because we map $(0,1)$ to $(0,0)$.
However, if I try to plot this by saying
f[u_] = g[u, Plot[u^2/4 - 1,{u,-100,100}]
I don't really get what I want. I suspect this is because of the resizing done by Graphics and Plot. I have tried using PlotRange and PlotRangeClipping, but nothing works.
Is there any way I can do this or do I need another method to draw this curve? As a matter of fact, can it be done without Inset?


