improved detalization
Source Link
Rom38
  • 5.2k
  • 14
  • 29

I guess, this is easy to do by combination of the Plot with Lines in Epilog:

enter image description here

Choosing the right function allows the change of the width of parabola, as you see.

UPD.: I guess, code is so simple that even beginner can realize how to do it..

Framed@Plot[{(x - 100)^2, 10 (x + 100)^2}, {x, -150, 150}, 
  PlotRange -> {-5, 500}, Axes -> False, 
  Prolog -> {Black, Thick, 
    Line@{{-130, 700}, {-130, 0}, {-70, 0}, {-70, 700}}, 
    Line@{{130, 700}, {130, 0}, {70, 0}, {70, 700}}}]

I guess, this is easy to do by combination of the Plot with Lines in Epilog:

enter image description here

Choosing the right function allows the change of the width of parabola, as you see

I guess, this is easy to do by combination of the Plot with Lines in Epilog:

enter image description here

Choosing the right function allows the change of the width of parabola, as you see.

UPD.: I guess, code is so simple that even beginner can realize how to do it..

Framed@Plot[{(x - 100)^2, 10 (x + 100)^2}, {x, -150, 150}, 
  PlotRange -> {-5, 500}, Axes -> False, 
  Prolog -> {Black, Thick, 
    Line@{{-130, 700}, {-130, 0}, {-70, 0}, {-70, 700}}, 
    Line@{{130, 700}, {130, 0}, {70, 0}, {70, 700}}}]
Source Link
Rom38
  • 5.2k
  • 14
  • 29

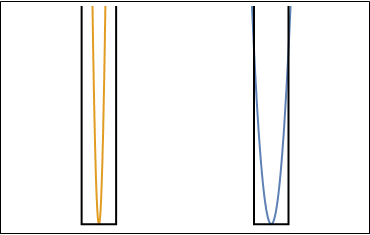
I guess, this is easy to do by combination of the Plot with Lines in Epilog:

enter image description here

Choosing the right function allows the change of the width of parabola, as you see