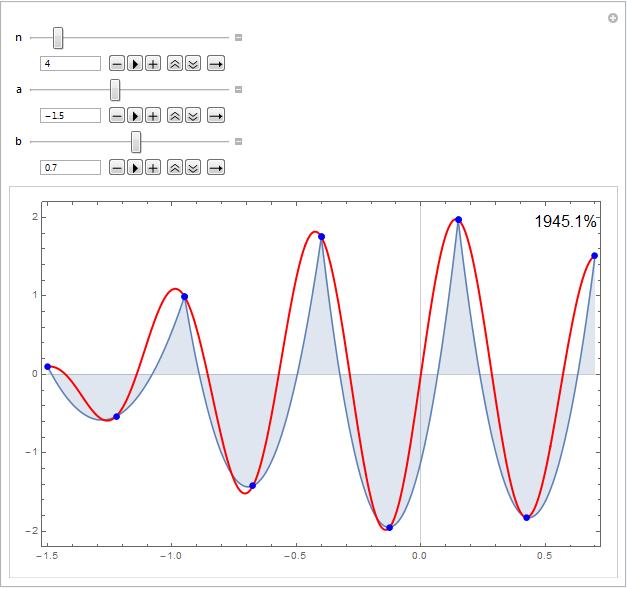
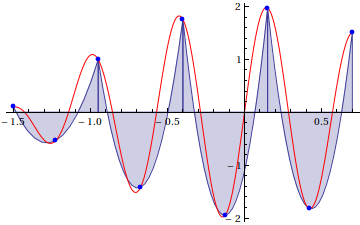
This question is related to Trapezoid approximation to definite integral. As promised, I am now asking about how to draw an approximation of integrals by parabolas. I tried to modify MarcoB's code, and I am using interpolation to create the parabolas. I guess that command doesn't get along with Graphics. I am attaching my code so you can spot my mistake. Thank you.
f[x_] := Sin[x]
Manipulate[
 polygons = {Table[{Green, Opacity[0.15], EdgeForm[Blue],
     Rectangle[{a + i (b - a)/n, 0}, {a + (i + 1) (b - a)/n,
       f[a + (i + 1) (b - a)/n]}]}, {i, 0, n - 1, 1}],
   Table[{Red, Opacity[0.15], EdgeForm[Blue],
     Rectangle[{a + i (b - a)/n, 0}, {a + (i + 1) (b - a)/n,
       f[a + (i + 1/2) (b - a)/n]}]}, {i, 0, n - 1, 1}],
   Table[{Yellow, Opacity[0.15], EdgeForm[Blue],
     Rectangle[{a + i (b - a)/n, 0}, {a + (i + 1) (b - a)/n,
       f[a + i (b - a)/n]}]}, {i, 0, n - 1, 1}],
   Table[{Yellow, Opacity[0.15], EdgeForm[Blue],
     Interpolation[{ {a + i (b - a)/n,
        f[a + i (b - a)/n]}, {a + (i + 1) (b - a)/n,
        f[a + (i + 1) (b - a)/n]}, {a + (i + 2) (b - a)/n,
        f[a + (i + 2) (b - a)/n]}, InterpolationOrder -> 2}], {i, 0,
      n - 2, 2}}],
   Table[{Cyan, Opacity[0.25], EdgeForm[Blue],
     Polygon[{{a + i (b - a)/n, 0}, {a + i (b - a)/n,
        f[a + i (b - a)/n]}, {a + (i + 1) (b - a)/n,
        f[a + (i + 1) (b - a)/n]}, {a + (i + 1) (b - a)/n, 0}}]}, {i,
     0, n - 1, 1}]};
 Show[{Plot[f[x], {x, a, b}, PlotStyle -> {Red, Thick},
    AxesOrigin -> {0, 0}], Graphics[polygons[[type]]]},
  ImageSize -> Large], {{a, -1}, -10, 10}, {{b, 6}, -10, 10}, {{n, 5},
   1, 40, 1}, {{type, 5, "Type of \nApprox"}, {1 -> "left rectangles",
    2 -> "mid rectangles", 3 -> "right rectangles",
   4 -> "par rectangles", 5 -> "trap"}}]
EDIT: Thank you MarcoB and J. M. After J. M.'s comment, I just tried to go back one step and now just try to plot the parabolas (without having to switch between rectangles and other figures). This is what I tried, but I don't know now how to make it plot every arc of a parabola only in the related interval (namely, I get the plots of the entire parabolas). How can I fix this?
f[x] = Sin[x]
a = 0
b = 2
n = 5
g = Table[
  InterpolatingPolynomial[{{a + i (b - a)/n,
     f[a + i (b - a)/n]}, {a + (i + 1) (b - a)/n,
     f[a + (i + 1) (b - a)/n]}, {a + (i + 2) (b - a)/n,
     f[a + (i + 2) (b - a)/n]}}, x], {i, 0, n - 1, 2}]
Plot[g, {x, 0, 2}]


RectangleandPolygonthat were used before are "Graphics primitive", i.e. they are representations of 2D graphical objects and as such they can be fed toGraphicsdirectly. The output ofInterpolationis anInterpolatingFunction. As you guessed,Graphicsdoesn't know what to do with it, so it spits it right out. This one will be quite a bit more laborious! $\endgroup$InterpolatingPolynomial[]that you can use to generate the explicit parabolas, as well as for deriving the integral of a parabola. A rendering is much more challenging: you can usePlot[]to render the parabola, and maybe useCases[]to extract theLine[]object representing the parabola. You can then use that for further renderings. $\endgroup$Plot[]to generate only arcs of the parabolas; something likeFirst[Cases[Plot[InterpolatingPolynomial[{{a, f[a]}, {b, f[b]}, {c, f[c]}}, x], {x, a, b}], _Line, Infinity]]yields aLine[]object representing a parabola arc through three points. $\endgroup$