15
$\begingroup$

I wanted to plot this function

$$f(x) =\begin{cases} 1 & \text{if } x= 0 \\ \tfrac1{q} & \text{if } x = \tfrac{p}{q}\\ 0 & \text{if } x \in \mathbb{R}-\mathbb{Q} \end{cases}$$

so I wrote

FuncThomae[x_] := If[ExactNumberQ[Rationalize[x]], If[x == 0, a = 1, 
                  L = #^-1 & /@ Divisors[Numerator[Rationalize[x]]]], a = 0]

and

ListDomain[xmin_, xmax_] := Table[Outer[List, {x}, FuncThomae[x]],
                            {x,xmin,xmax,0.001}] // Flatten[#, 1] &

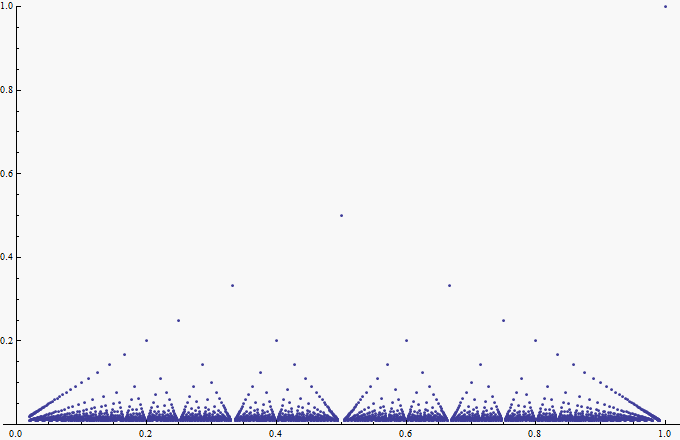
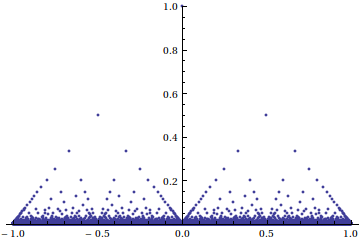
My result doesn't take all the real numbers (nor negatives) in its domain, and for $-1$ to $1$, it should have looked like so:

plot of Thomae's function

but my function does not cater to negatives, nor does it look like the above plot. It looks like this from 2 to 5:
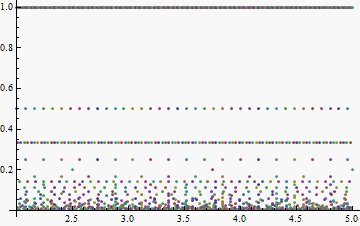
erroneous plot

Nearly similar, but not quite. Can someone help me to perfect the function?

Wanted to duplicate this

$\endgroup$
4
  • $\begingroup$ Hi there, is the code you supplied complete, I didn't seem to be able to get it to run successfully ? $\endgroup$ May 13, 2012 at 11:38
  • $\begingroup$ @image_doctor it does run. what was the problem? BTW you need to plot the generated list using the ListDomain function i coded as argument for the ListPlot Function..... $\endgroup$ May 13, 2012 at 12:42
  • $\begingroup$ Outer::ipnfm: "Positive machine-sized integer or Infinity expected at position 3 in Outer[List,{2.},0]." Is the error I get. a and L seem not to be defined in the code segment you have posted. But as you have an answer, perhaps it isn't important :) $\endgroup$ May 13, 2012 at 17:31
  • $\begingroup$ A tiny reminder: in floating-point arithmetic (which is what Mathematica internally uses when plotting), all numbers are rational. $\endgroup$ May 14, 2012 at 11:15

4 Answers 4

18
$\begingroup$

I'd suggest producing a list of rational numbers and then plot the function there, like so:

maxq = 100;
fracs = Table[p/q, {q, 2, maxq}, {p, 2, q}] // Flatten // DeleteDuplicates;
pq = {#, 1/Denominator @ #} & /@ fracs;

ListPlot[pq, PlotRange -> {0, 1}]

Thomae's function

$\endgroup$
8
  • 1
    $\begingroup$ If you define pq as pq = {#, 1/Denominator[#]}& /@ fracs you could ListPlot pq directly without having to transform it first. $\endgroup$
    – Heike
    May 13, 2012 at 12:39
  • $\begingroup$ @acl thanks for the lovely answer but the plot is missing the first bit it isnt plotting 1 when x is 0 but anyway thanks.... $\endgroup$ May 13, 2012 at 13:19
  • $\begingroup$ btw could you do this for -1 to 1 $\endgroup$ May 13, 2012 at 13:20
  • $\begingroup$ @The-Ever-Kid yes that bit is straightforward, so I didn't bother implementing it $\endgroup$
    – acl
    May 13, 2012 at 13:20
  • $\begingroup$ yeah cool thanks... $\endgroup$ May 13, 2012 at 13:23
13
$\begingroup$

Why not use DiscretePlot directly?

DiscretePlot[1/Denominator[Rationalize[x]], {x, -1, 1, 1/(2*3*4*5*6*7)}, 
       PlotRange -> {0, 1}, Filling -> None, RegionFunction -> Function[{x, y}, Abs[x] != 1]]

The RegionFunction throws out the cases where $\frac{p}{q}=1$.

Thomae function

$\endgroup$
0
12
$\begingroup$

Another possibility that avoids the generation of fractions not in lowest terms (and thus the use of Union[] or DeleteDuplicates[]) rests on generating a Farey sequence, and then applying the Dirichlet-Thomae function to that:

farey[n_Integer?Positive] := Module[{v = 0, w = 1, p = 1, q = n, t},
  Join[{0, 1/n}, Flatten[Last[
     Reap[While[p < q,
       t = Quotient[n + w, q];
       {{p, v}, {q, w}} = {{t p - v, p}, {t q - w, q}};
       Sow[p/q]]]
     ]]]]

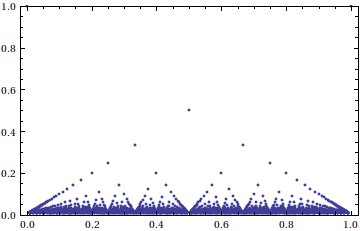
ListPlot[{#, 1/Denominator[#]} & /@ farey[100], Frame -> True, PlotRange -> {0, 1}]

Thomae's function applied to the Farey sequence

$\endgroup$
1
2
$\begingroup$

A quick look at a Table of the outcomes of your code shows pretty much what the problem is. If

FuncThomae[x_] := If[
  ExactNumberQ[Rationalize[x]],
  If[x == 0,
   1,
   L = #^-1 & /@ Divisors[Numerator[Rationalize[x]]]
   ]
  , 0]

then Table[FuncThomae[x], {x, 0, 1, 0.1}] produces

{1, {1}, {1}, {1, 1/3}, {1, 1/2}, {1}, {1, 1/3},
  {1, 1/7}, {1, 1/2, 1/4}, {1, 1/3, 1/9}, {1}}

which makes it clear that the function is not producing numbers as output like it should.

If you want a working functional version of the Thomae function, the naive try

FuncThomae[x_] := If[
  ExactNumberQ[Rationalize[x]],
  If[x == 0,
   1,
   1/Denominator[Rationalize[x]]
   ]
  , 0
  ]

does work, and you do not need to worry about eliminating common factors with the numerator before asking for the Denominator because the latter does the procedure as standard. (If not, what unique number could it produce?) With that version, Table[FuncThomae[x], {x, 0, 1, 0.1}] produces

{1, 1/10, 1/5, 1/10, 1/5, 1/2, 1/5, 1/10, 1/5, 1/10, 1}

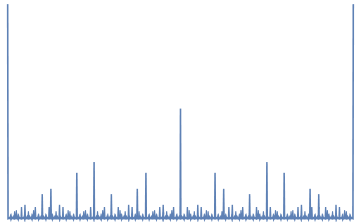
and if you graph it using, say, DiscretePlot[FuncThomae[x], {x, 0, 1, 0.001}, PlotRange -> Full, Axes -> False], you get

Mathematica graphics

Note, however, that this plot is not correct, because any discrete scan is going to miss points like $f(1/3)=1/3$. To get those points, run a plot like

ListPlot[
 Flatten[Table[
   {p/q, FuncThomae[p/q]}
   , {p, 0, 100}, {q, 1, 100}], 1]
 , PlotRange -> {{0, 1}, {0, 1}}, Axes -> False
 ]

to produce

Mathematica graphics

$\endgroup$

Your Answer

By clicking “Post Your Answer”, you agree to our terms of service and acknowledge that you have read and understand our privacy policy and code of conduct.

Not the answer you're looking for? Browse other questions tagged or ask your own question.