I'm inspecting the Cantor pairing function, that we can find on this link here.
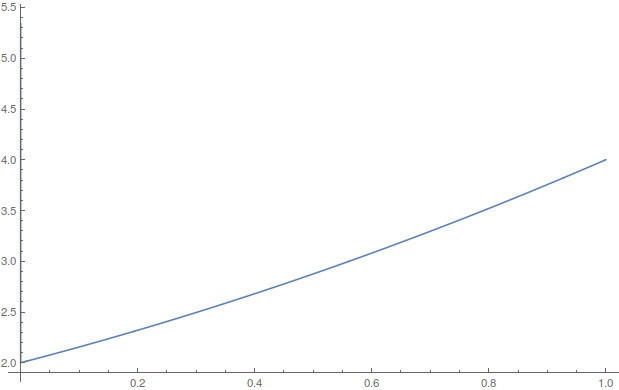
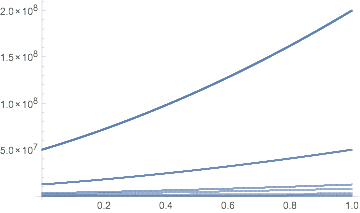
But the strange thing is that Mathematica is outputting a wrong result to me. The code below shows the strange behavior. When we plot the Q2N1 function, the $y$-axis does not corresponds to the correct value. See:
Q2N0[q_] := (Numerator[q] + Denominator[q] + 1)
            (Numerator[q] + Denominator[q])/2 + Denominator[q]

Q2N[q_] := Q2N0[Rationalize[q]]

Q2N1[q_] := Q2N[N[q, 10]]

Q2N1[0.2]

Out[13]= 26

Plot[Q2N1[x], {x, 0, 1}]
As we can see, confronting the code with the plot, when x = 0.2 the correct value is 26, but Mathematica plot function returns a value near of 2.25. The truth is all returned values should be integers or very near to integers, so 2.25 could never be a result. Crazy.
Why this is happening? And, how can we have the correct output?
Edit
I think that I reached a plot with Mathematica, using some ideas presented in the answers. Looks like the problem was with Rationalize. Doing some tests I have found that need to pass a 0 argument, without it the function 'ignores' Rationalize. See below:
Q2N0[q_] := (Numerator[q] + Denominator[q] + 1)
            (Numerator[q] + Denominator[q])/2 + Denominator[q]

Q2N1[q_] := Q2N0[Rationalize[q, 0]]

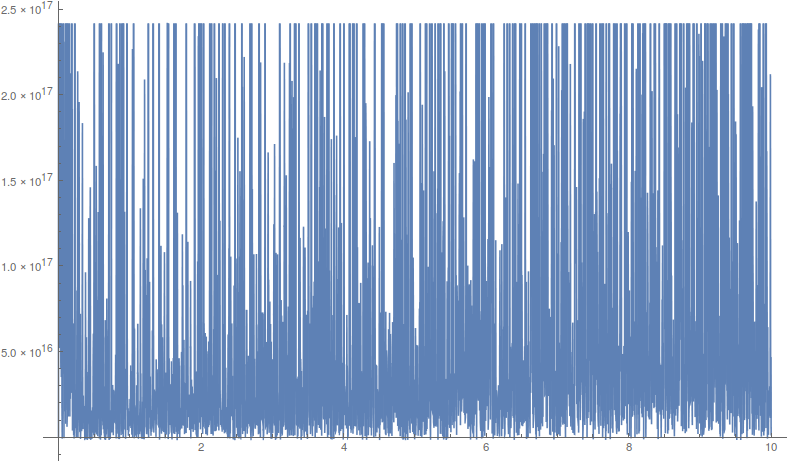
Plot[Q2N1[x], {x, 0, 10}]
But I'm still having a problem. FindRoot now brings a strange result. Crazy bis =)
Let's see:
In[125]:= Rationalize[5.588723439378913`, 0]

Out[125]= 97873229/17512627

In[127]:= Q2N1[5.588723439378913`]

Out[127]= 6656947957631923

In[130]:= FindRoot[Q2N1[x] == 26, {x, 0.1}]

Out[130]= {x -> 5.58872}
But Q2N1 is a bijection and Q2N1[x] == 26 when x is 0.2. Even if was not a bijection, Q2N1[5.588723439378913] evaluates to 6656947957631923 instead of 26. (See that when I copied and paste 5.58872, Mathematica paste 5.588723439378913 instead of 5.58872).
So, how can we manipulate this function that it will plot OK (already achieved as looks like) and the FindRoot will find the correct root (or at least try it, instead of brings some strange 5.58872 result?

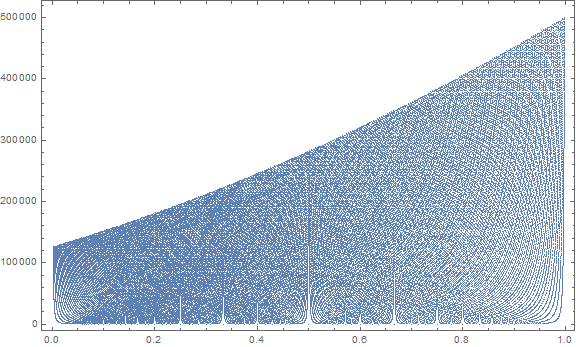
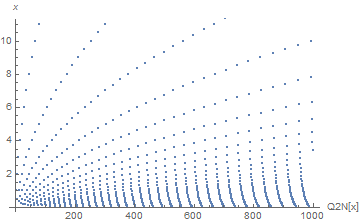
Q2Nis not continuous. AlthoughQ2N[.2]is26,Q2N[.211]is734866. By the way, becauseQ2Nproduces integers,Q2N1merely reproduces the output ofQ2N. $\endgroup$x=0.2the y axis is about2.25and not an integer. This plot could be a very crazy with several values jumping to strange areas, but not this strange moody curve... $\endgroup$Q2N0[x]. Evidently,qis not being passed inRationalizeform. Strange. $\endgroup$