How to plot this function in Mathematica?
3 Answers
$\begingroup$
$\endgroup$
6
dirichlet[x_] := If[IntegerQ[Numerator[Rationalize[x]]], 1, 0]

dirichlet[1.24898]
dirichlet[Pi]
1
0
-
$\begingroup$ How about dirichlet[N[Sqrt[Pi/Exp[1]], 10]]? $\endgroup$ Commented Dec 19, 2017 at 18:10
-
$\begingroup$ @user64494 gives me 0 in MMA11.1 - is that wrong? $\endgroup$– SumitCommented Dec 20, 2017 at 7:16
-
-
$\begingroup$ @Sumit: Up to the definition, it should result 1. $\endgroup$ Commented Jan 19, 2018 at 8:19
-
$\begingroup$ @Kuba, I don't have a rational answer for that. $\endgroup$– SumitCommented Jan 19, 2018 at 9:00
$\begingroup$
$\endgroup$
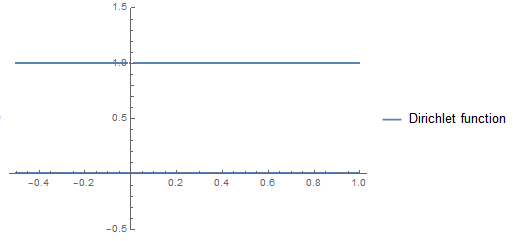
Faked by ListLinePlot and improved code borrowed from bill s
d[x_] := Piecewise[{{1, Abs[Rationalize[x, 0.0003] - x] > 0.0002}, {0,True}}];
ListLinePlot[Table[{x, d[x]}, {x, -1/2, 1, 0.0001}],
MeshStyle -> PointSize[Small], Mesh -> {Range[-1/2, 1, 0.0001]},
MeshFunctions -> {#1 &}, MeshShading -> {White, White},
PlotRange -> {Automatic, {-1/2, 3/2}},
PlotLegends -> {"Dirichlet function"}]
$\begingroup$
$\endgroup$
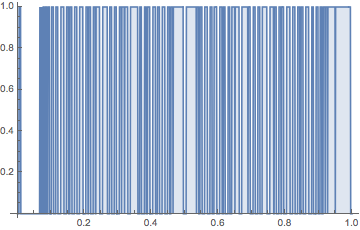
Of course you can't really plot this function, since it is discontinuous everywhere. But you can fake it:
d[x_] := Piecewise[{{1, Abs[Rationalize[x, 0.01] - x] > 0.004}, {0, True}}];
DiscretePlot[d[x], {x, 0, 1, 0.001}]
By playing with the second argument of the Rationalize and the value in the inequality, you can change the detailed appearance of the function.


Rationalize$\endgroup$Plot[{0, 1}, {x, -1, 2}, PlotStyle -> Black, PlotRange -> {Automatic, {-1/2, 3/2}}]. Anyway, you can't really plot Dirichlet function... $\endgroup$Thomae's functionclick here: mathworld.wolfram.com/notebooks/NumberTheory/… $\endgroup$