I wanted to plot this function
$$f(x) =\begin{cases} 1 & \text{if } x= 0 \\ \tfrac1{q} & \text{if } x = \tfrac{p}{q}\\ 0 & \text{if } x \in \mathbb{R}-\mathbb{Q} \end{cases}$$
so I wrote
FuncThomae[x_] := If[ExactNumberQ[Rationalize[x]], If[x == 0, a = 1,
                  L = #^-1 & /@ Divisors[Numerator[Rationalize[x]]]], a = 0]
and
ListDomain[xmin_, xmax_] := Table[Outer[List, {x}, FuncThomae[x]],
                            {x,xmin,xmax,0.001}] // Flatten[#, 1] &
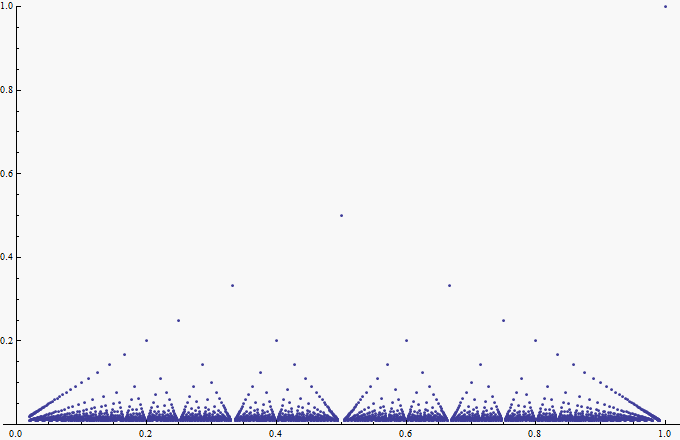
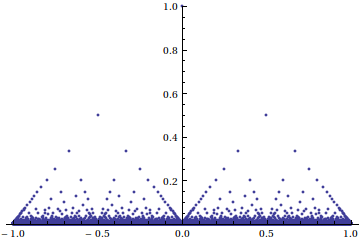
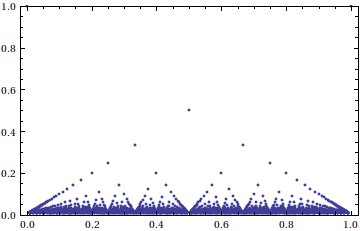
My result doesn't take all the real numbers (nor negatives) in its domain, and for $-1$ to $1$, it should have looked like so:

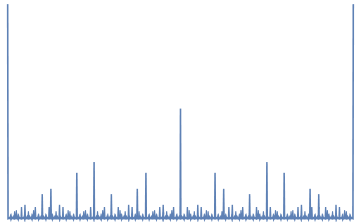
but my function does not cater to negatives, nor does it look like the above plot. It looks like this from 2 to 5:
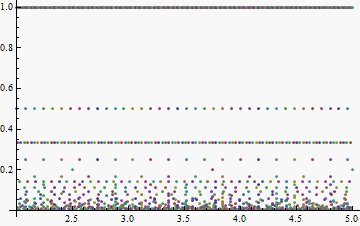
Nearly similar, but not quite. Can someone help me to perfect the function?


aandLseem not to be defined in the code segment you have posted. But as you have an answer, perhaps it isn't important :) $\endgroup$