19
$\begingroup$

I want some high-quality 2D graphics produced by Mathematica in my paper.

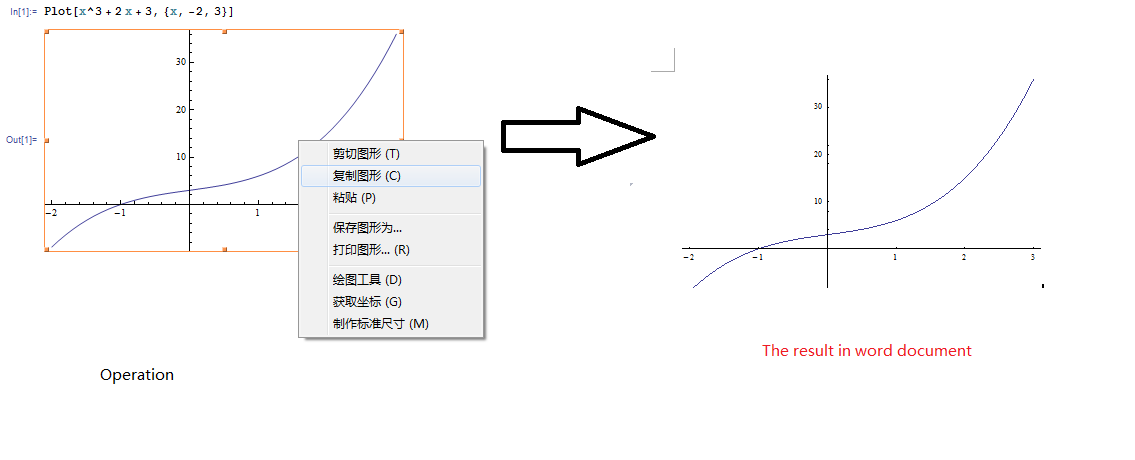
My step-by-step operation as follows:

First I make the plot, for example,

Plot[x^3 + 2 x + 3, {x, -2, 3}]

Then I

  1. click the right mouse button
  2. copy the figure
  3. paste in my Word document

However, I discover that Word renders my graphic jaggedly.

So my question is: how can I extract a graphic from my notebook and transfer it to Word preserving full Mathematica quality?

enter image description here

$\endgroup$
6
  • 1
    $\begingroup$ Works fine under OSX10.9.4, MaMaV10 and Word2011V14.4.3. Try ctrl v or/and Paste as "Picture" or Paste as "PDF". Same behavior? Then check this link. Alternatively you can use "Save Selection As" and choose an appropriate format for exporting/importing. $\endgroup$
    – user9660
    Commented Jul 13, 2014 at 3:42
  • 1
    $\begingroup$ select the graphics, go to file>save selection as. Change Files of type from PDF to any image format (I suggest PNG for better resolution) and save the picture. Now import (copy the picture file and paste in word), and I hope you will get a better resolution. $\endgroup$
    – Sumit
    Commented Jul 13, 2014 at 10:51
  • 3
    $\begingroup$ Here's a thread with a similar issue: mathematica.stackexchange.com/questions/43378/… $\endgroup$ Commented Jul 13, 2014 at 15:39
  • $\begingroup$ I'm going to second the suggestion of saving as PNG. There are many other ways to do it, but that's pretty straightforward and works fairly well. I believe if you copy-paste into word, it rasterizes the image poorly. $\endgroup$ Commented Sep 30, 2014 at 9:24
  • 3
    $\begingroup$ I tagged this with windows because the solutions are OS specific and the OP seems to use Windows. On Windows Mathematica uses the EMF format for copying vector graphics to the clipboard. On OS X it uses PDF. There's a very significant difference in quality. $\endgroup$
    – Szabolcs
    Commented Apr 15, 2015 at 16:43

3 Answers 3

19
$\begingroup$

If you need to achieve the best possible quality I strongly recommend against using the Clipboard for transferring graphics. Under Windows the clipboard will contain a Windows Metafile generated with display resolution fidelity! This is the reason why you see jaggies.

The same is true for the vector graphics files generated by Mathematica's Save Selection As... menu item. For achieving the best possible quality always use the Export command.

Instead of copying I recommend to Export your graphics as EPS and then import it in your Word document. Note that most scientific journals recommend to provide graphics in the resolution-independent EPS format.

One possible difficulty with EPS is that it does not support semi-transparency. If your graph contains transparent objects you cannot directly Export it as correct EPS file from Mathematica.

Another problem is that MS Office supports EPS only up to PostScript level 2 while Export "generally creates PostScript level 2 files, and includes certain level 3 features if appropriate." MS Office fails to import EPS file when it contains PostScript level 3 features and unfortunately it is currently impossible to restrict Export for writing only level 2 files.

I expand these topics and provide workarounds in these answers:

If you are not satisfied with EPS, I recommend you to Export your graphics as EMF. EMF has an advantage of being the native vector graphics format on Windows but unlike EPS and PDF it does not support font embedding. EMF files Exported from Mathematica also have much lesser vector precision than EPS, PDF and SVG files generated by Export. So EPS is much more advanced as compared to EMF but also is much more difficult to deal with because MS Office support of this format is rudimentary.

If you use VertexColors in your graph (which PDF format supports but Mathematica's Export still does not) or there are other reasons why EPS, EMF and PDF give unsatisfactory results you may consider rasterizing your graph and Exporting it as PNG with high resolution. This is not always an easy task because Mathematica's Graphics by default is NOT resolution-independent: Ticks and TickLabels by default do not scale with the whole Graphics! It is huge headache for any Mathematica user for many years and there is still no easy workaround. In the most cases the best way is to Export as PDF from Mathematica and then export the graph from your favorite PDF renderer to PNG. Other workarounds include some preprocessing inside of Mathematica and/or using third-party software.

Here is an example of the preprocessing approach which gives small file size without loss of quality:

$\endgroup$
2
  • $\begingroup$ @AlexeyPopkov, transparent means Opacity less than 1? $\endgroup$ Commented Oct 5, 2014 at 17:38
  • $\begingroup$ @alancalvitti Yes, between 0 and 1. When Opacity is 1 or 0 it is treated in a special way AFAIK. $\endgroup$ Commented Oct 6, 2014 at 0:27
3
$\begingroup$

It is a problem for the reasons @Alexey Popkov explains.

My workaround is to have one graphics format for the publisher and different one for printing PDFs from Word.

For printing PDFs from Word, the one thing that has ended up working nicely for me is to create large PNG files, which you then adjust to size in Word. For sending files to the publisher, you can produce PDF files of the graph at the size you want directly from Mathematica. In other words, you choose the font sizes you want for the text on your graphs and produce them at the size you want. In Inches, the size seems to be 100 units of ImageSize per inch, so you will use Export["filePathAndName.pdf", graphname, ImageResolution->1200, ImageSize->3.75 100] in order to produce a PDF file that the printer will insert in the text and which graph will have a width of 3.75 inches on the printed page.

You could insert this PDF into Word by using Alt-i-o (/insert/object, then the tab "From File") but my experience is that its quality will deteriorate. It will neither look good on the page nor in the PDF printed from Word.

Instead, you need to produce a PNG file in large resolution; in this example use Export["filePathAndName.png", graphname, ImageResolution->1200, ImageSize->3.75 100]. Import the graph into your Word document using Alt-i-p-f (/insert/picture/from file). Word will ignore the size that you have set but you can right-click the graph, choose "Size and Position" from the drop-down menu, and set the size you want (3.75 inches width in the example). This will look sharp on the Word screen and the PDF files you produce from Word.

Now, because I work in Mathematica in 75% magnification, these graphs look far too small on my screen. So for the screen, I use larger font and resolution of image units for inches. I use 267 for inch units of graph size and 42 as the font size that corresponds to fonts of size 12. At my initialization cell, I have a line like If[True,{ftsz=12,imgsz=100},{ftsz=42,imgsz=267}]; and define font sizes and image sizes using the variables, e.g., Graph[primitives and any fonts defined using ftsz ,BaseStyle->{font family choices etc. ,FontSize->ftsz},ImageSize->3.75 imgsz]. The graphs will be nice and large to see on the screen while you are building them using Mathematica and the False setting in the If statement, then render them again for Exporting after changing that If statement to True. But be careful, if you export the large-dimension PNG graph not to set resolution at 1200 or you may, like me, get out of memory errors. But it may look better in Word than the 3.75-inch graph with the 1200 resolution.

I know, this should be easier. Perhaps I am missing some trick and someone will point it out in the comments.
$\endgroup$
0
$\begingroup$

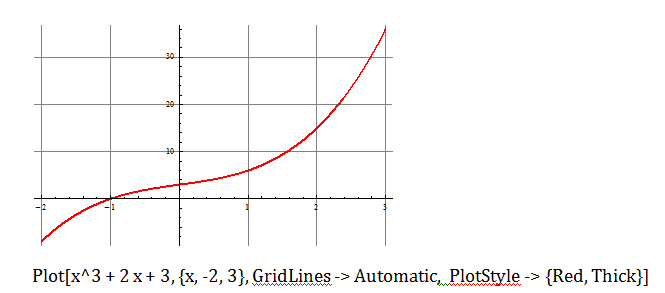
Use Bitmap to save. Also PlotStyle-> {Red,Thick} for thicker plot lines.

JaggedLine However am still unable to explain why the thin red line and thicker one are jagged ( display different thicknesses) above y = 22.

$\endgroup$
1
  • $\begingroup$ Hi ! Can you elaborate a bit ? $\endgroup$
    – Sektor
    Commented Sep 29, 2014 at 20:32

Your Answer

By clicking “Post Your Answer”, you agree to our terms of service and acknowledge you have read our privacy policy.