6
$\begingroup$

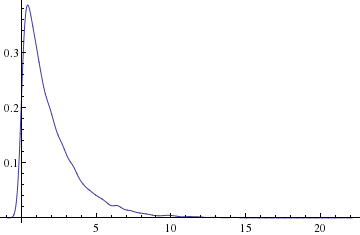
When using SmoothHistogram (to plot probability distribution function), I noticed that the edge of the figure is automatically smoothed towards zero probability. However, in some probability distributions (or some data), this is not the case. For example,

SmoothHistogram[RandomVariate[GammaDistribution[1, 2], 10000]]
enter image description here

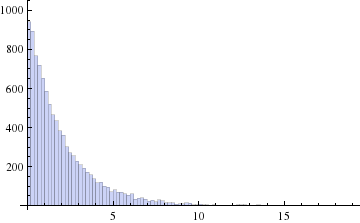
Note that at nearly zero value of x-axis, the probability distribution drops. This is incorrect. To see that, here is the result from Histogram, which shows correctly the sharp boundary:

Histogram[RandomVariate[GammaDistribution[1, 2], 10000]]
enter image description here

Note that the Histogram plot is correct, as one can check using

Plot[PDF[GammaDistribution[1, 2], x], {x, 0, 20}, Filling -> Axis]

Is it possible to tell SmoothHistogram not trying to interpolate the end points with zero?

$\endgroup$
4
  • 2
    $\begingroup$ I believe my answer to this question is what you are looking for. $\endgroup$
    – Andy Ross
    Commented May 2, 2014 at 14:17
  • $\begingroup$ @Kuba : I didn't... Why it is strange :) $\endgroup$
    – Yi Wang
    Commented May 2, 2014 at 14:37
  • $\begingroup$ @AndyRoss : Thanks a lot! Yes, this is exactly what I want. I think this question can be labelled as duplicated. Sorry I searched but haven't been able to find this post until you point out. $\endgroup$
    – Yi Wang
    Commented May 2, 2014 at 14:38
  • $\begingroup$ @Kuba I see. Thanks :) $\endgroup$
    – Yi Wang
    Commented May 2, 2014 at 14:39

1 Answer 1

3
$\begingroup$

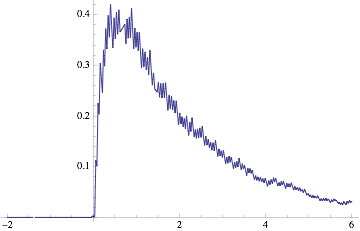
The nature of the kernel smoothing process will not allow you to have a discontinuity. If you use SmoothKernelDistribution, then you can set the shape of the kernel used for the smoothing (SmoothHistogram doesn't seem to have this option). For your problem, you could choose the kernel to be (for instance) a decaying exponential and then you would be smoothing only to the right.

data = RandomVariate[GammaDistribution[1, 2], 10000]; d2 = 
SmoothKernelDistribution[data, Automatic, If[# > 0, Exp[-#], 0] &];
Plot[PDF[d2, x], {x, -2, 6}]

enter image description here

Unfortunately, even using such a one-sided smoothing kernel does not do what you want. It fixes the problem of showing values to the left of zero (as happens with a Gaussian kernel) but will still not allow discontinuities.

$\endgroup$

Not the answer you're looking for? Browse other questions tagged or ask your own question.