2
$\begingroup$

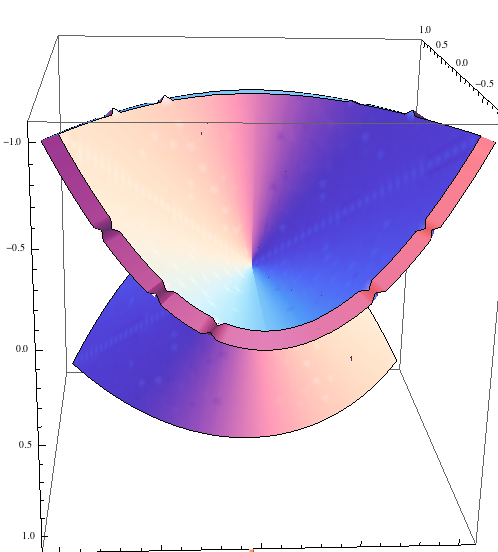
I am using a ContourPlot3D to plot an object with thickness. I noticed that the edges in the negative region are sharp and distorted. Is there a way to remove these distortions?

Code is the following:

    ContourPlot3D[ x*z - y^2 == 0, {x, -1, 1}, {y, -1, 1}, {z, -1, 1}, 
      Mesh -> None, ContourStyle -> Thickness[0.1]]

Please note that this code works in Mathematica 9 but for some reason, the plot shows no thickness in Mathematica 10.

The distortion is shown below.

enter image description here

$\endgroup$
3
  • $\begingroup$ How about ContourPlot3D[x z - y^2, {x, -1, 1}, {y, -1, 1}, {z, -1, 1}, Contours -> {-0.1, 0.1}, Mesh -> None, ContourStyle -> Yellow]? This works in 10 $\endgroup$
    – Feyre
    Commented Jul 10, 2016 at 14:27
  • $\begingroup$ @Feyre Yes it works in 10. But is it possible to fill the region between these contours? I need this for 3D printing. $\endgroup$ Commented Jul 10, 2016 at 14:32
  • $\begingroup$ Using the contours method is changing the shape of the object and I prefer other methods that could specify the thickness. $\endgroup$ Commented Jul 10, 2016 at 15:07

1 Answer 1

8
$\begingroup$

Update

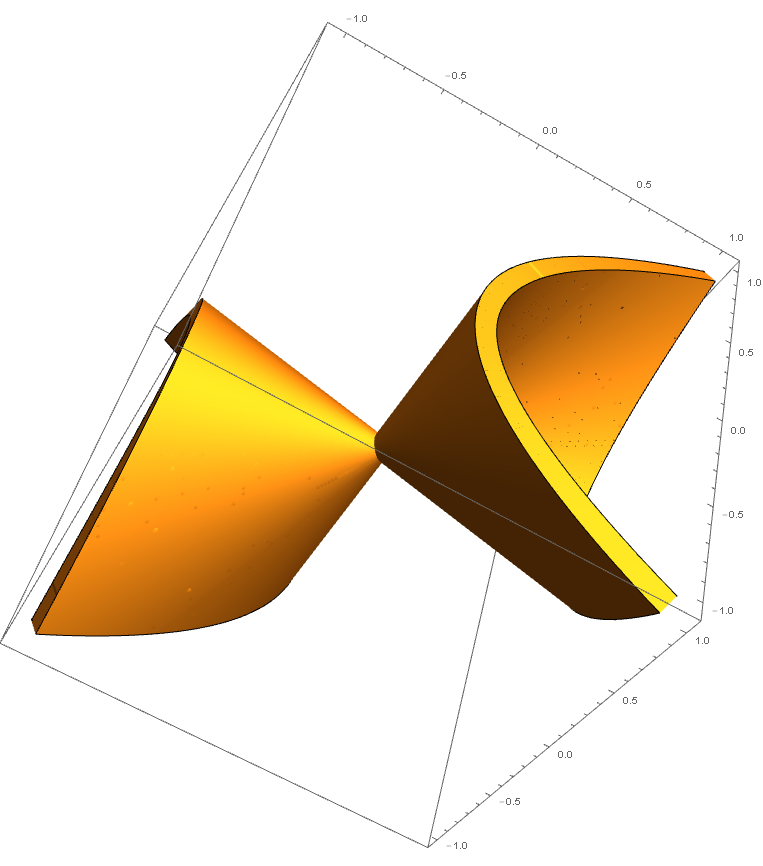
Creating a table of data for the evaluated function allows for control of "grid" size and domain which produces the smoothest part once plotted.

data = Table[x*z - y^2, {z, -1, 1, 0.01}, {y, -1, 1, 0.01}, {x, -1, 1, 0.01}];
ListContourPlot3D[data, Contours -> {0}, Mesh -> None, 
   Extrusion -> 0.1, DataRange -> {{-1, 1}, {-1, 1}, {-1, 1}}]

enter image description here


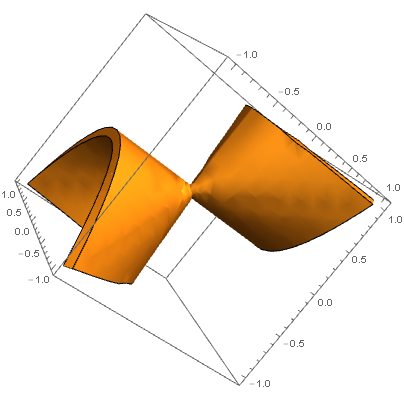
Use the undocumented Extrusion option and increase PlotPoints for higher resolution:

ContourPlot3D[x*z - y^2 == 0, {x, -1, 1}, {y, -1, 1}, {z, -1, 1}, 
 Mesh -> None, Extrusion -> 0.1,PerformanceGoal -> "Quality", PlotPoints -> 500]

enter image description here

References:

How to add Thickness in ListContourPlot3D

Increase 3D Graph thickness for 3D printing in Mathematica?

$\endgroup$
6
  • $\begingroup$ Is the ParametricPlot3D even plotting the same plot? It is not and I don't think I could use 3 variables with this. Extrusion is giving distortion again. $\endgroup$ Commented Jul 10, 2016 at 15:17
  • $\begingroup$ You can use ParametricPlot3D with your surface equation. I updated the answer. ContourPlot3D seems to be of better quality. $\endgroup$
    – Young
    Commented Jul 10, 2016 at 15:26
  • $\begingroup$ None of the methods are giving a result that I could use for 3D printing. The sharp edges are still there. $\endgroup$ Commented Jul 10, 2016 at 15:34
  • $\begingroup$ Having done a significant amount of high resolution 3D printing, using the first option with a high PlotPoint number would be sufficient. $\endgroup$
    – Young
    Commented Jul 10, 2016 at 15:36
  • $\begingroup$ @AbdulrahmanKalbat Take a look at the answer now, I've updated with a new method $\endgroup$
    – Young
    Commented Jul 10, 2016 at 16:01

Your Answer

By clicking “Post Your Answer”, you agree to our terms of service and acknowledge you have read our privacy policy.

Not the answer you're looking for? Browse other questions tagged or ask your own question.