When using SmoothHistogram (to plot probability distribution function), I noticed that the edge of the figure is automatically smoothed towards zero probability. However, in some probability distributions (or some data), this is not the case. For example,
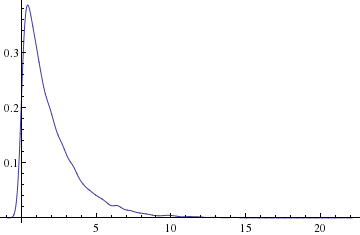
SmoothHistogram[RandomVariate[GammaDistribution[1, 2], 10000]]

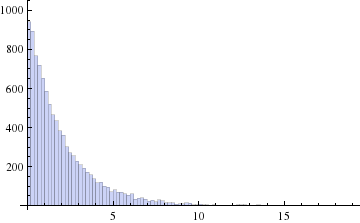
Note that at nearly zero value of x-axis, the probability distribution drops. This is incorrect. To see that, here is the result from Histogram, which shows correctly the sharp boundary:
Histogram[RandomVariate[GammaDistribution[1, 2], 10000]]

Note that the Histogram plot is correct, as one can check using
Plot[PDF[GammaDistribution[1, 2], x], {x, 0, 20}, Filling -> Axis]
Is it possible to tell SmoothHistogram not trying to interpolate the end points with zero?

