4
$\begingroup$

I am interested in finding an analytic expression for the below cdf of an order distribution, whose form I now describe.

Suppose that the time until a particular process occurs can be modelled as the sum of two gamma random variables: $\tau=t_1+t_2$, where $t_1\sim\text{gamma}(a,b)$ and $t_2\sim\text{gamma}(c,d)$ and $a\neq c$ and $b\neq d$.

In Mathematica, I can get a distribution that describes $\tau$ using:

bDist = TransformedDistribution[ u + v, {u \[Distributed] GammaDistribution[a, b], v \[Distributed] GammaDistribution[c, d]}]

Now suppose I have $n$ independent random variables of the above composite gamma, each of which is $\tau_i$ (that is, in Mathematica, each distribution is described by bDist). Further, suppose that I am interested in $T=\text{min}(\tau_1,...,\tau_n)$, that is, the time taken for the first such process to occur.

$T$ is the 1st order statistic of the composite distribution; that is, in Mathematica:

cDist = OrderDistribution[{bDist, n}, 1];

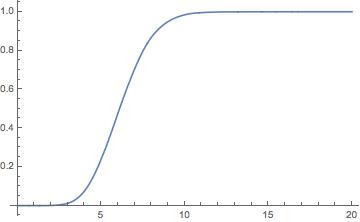
For a particular set of parameters, I can use simulation to estimate what the cdf for the above distribution looks like:

temp = RandomVariate[ cDist /. {a -> 8, b -> 0.5, c -> 3, d -> 2, n -> 5}, 10000];

approxDist = SmoothKernelDistribution[temp];

Plot[CDF[approxDist, x], {x, 0, 20}]

which produces a curve like:

enter image description here

My question is, is there a way to derive an analytic expression for the above curve for any set of parameters?

I have tried:

Assuming[n >= 1 && n \[Element] Integers && a > 0 && b > 0 && c > 0 && d > 0, CDF[cDist, x]]

But Mathematica just returns this unevaluated (after much thought).

$\endgroup$
2
  • 1
    $\begingroup$ The order distribution needs the CDF for bDist but it is unlikely that there is an analytic expression for that. $\endgroup$
    – JimB
    Commented Jan 26, 2020 at 0:08
  • $\begingroup$ I know you want $b\neq d$ but if you allow $b=d$, then there is an analytic expression. See stats.stackexchange.com/questions/252191/…. From that link I think the answer is $1-\left(\frac{\Gamma (a+c,x/b)}{\Gamma (a+c)}\right)^n$. $\endgroup$
    – JimB
    Commented Feb 16, 2020 at 22:05

1 Answer 1

1
$\begingroup$

Well maybe one can find a general form for the cdf and pdf in terms of n given specified values of $a$, $b$, $c$, and $d$. Using your example the PDF's for n=2 to 6 are the following:

bDist = TransformedDistribution[u + v, 
  {u \[Distributed] GammaDistribution[a, b], 
   v \[Distributed] GammaDistribution[c, d]}];

The pdf for a single observation from bDist is given by

Simplify[PDF[bDist, z] // FunctionExpand, Assumptions -> z > 0]
(* (b^-a d^-c E^(-(z/d)) z^(-1 + a + c)*
   Hypergeometric1F1[a, a + c, (-(1/b) + 1/d) z])/Gamma[a + c] *)

So using the definition of the pdf and cdf for the minimum of a sample size of n we can write the following function that gives both the pdf and cdf:

pdfcdf[n_, a_, b_, c_, d_] := Module[{pdf0, cdf0, bDist},
  pdf0 = (b^-a d^-c E^(-(z/d)) z^(-1 + a + c)*
      Hypergeometric1F1[a, a + c, (-(1/b) + 1/d) z])/Gamma[a + c] //  FullSimplify;
  cdf0 = Integrate[pdf0, {z, 0, z0}, Assumptions -> z0 > 0] /. z0 -> z;
  {n pdf0 (1 - cdf0)^(n - 1) // FullSimplify, 1 - (1 - cdf0)^n}]

Using your example:

pc = pdfcdf[n, 8, 1/2, 3, 2]

[![PDF and CDF in terms of sample size n][1]][1]

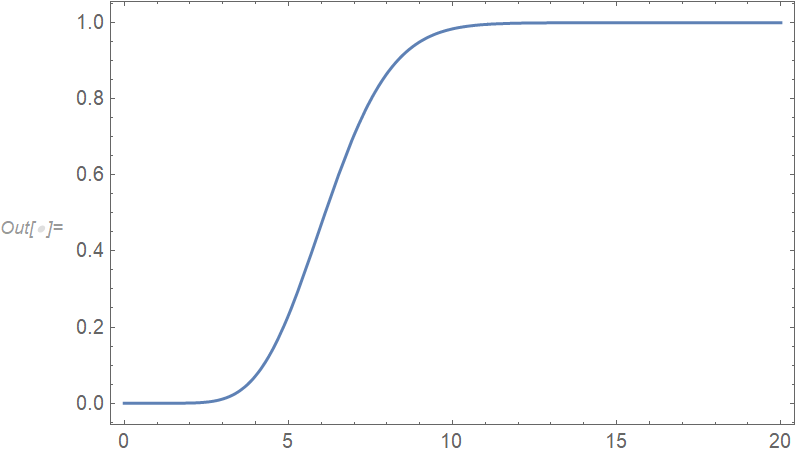
Plot[pc[[2]]/.n->5, {z, 0, 20}, Frame -> True]

CDF of minimum order statistic for sample size of 5

$\endgroup$

Your Answer

By clicking “Post Your Answer”, you agree to our terms of service and acknowledge you have read our privacy policy.

Not the answer you're looking for? Browse other questions tagged or ask your own question.