39
$\begingroup$

I have a plot with ErrorListPlot

data = Sort@RandomReal[1, {10, 2}];
error = RandomReal[0.5, 10];
errorplot = ErrorListPlot[
  Partition[Riffle[data, ErrorBar /@ error], 2],
  Joined -> True]
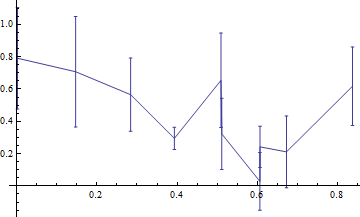
Mathematica graphics

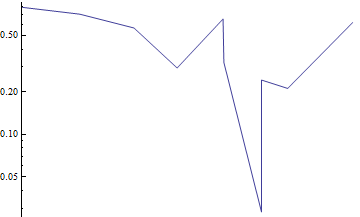
However, I would like to have it with the y-axis on a log scale. I can use ListLogPlot to get the log scale but this doesn't plot the errorbars.

logplot = ListLogPlot[
  data,
  PlotRange -> All,
  AxesOrigin -> {0, 0},
  Joined -> True
  ]
Mathematica graphics

I tried Show[logplot, errorplot, PlotRange->All] to see if it would plot with the scale and ticks from the logplot but that didn't work right:
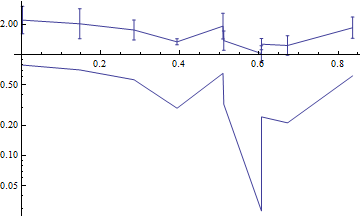
Mathematica graphics

I also tried to take the Ticks from the logplot: Show[errorplot, Ticks -> Ticks /. AbsoluteOptions@logplot] but that just gives an error.

I tried to manually take the log of the data and then grab the tick-marks but that didn't work right

data = Sort@RandomReal[{10, 100}, {10, 2}];
error = RandomReal[20, 10];
logdata = Transpose[{data[[All, 1]], Log[10, data[[All, 2]]]}];
errorup = Log[10, data[[All, 2]] + error] - logdata[[All, 2]];
errordown = Log[10, data[[All, 2]] - error] - logdata[[All, 2]];
logerror = Log[10, error];
logplot = ListLogPlot[
  data,
  Joined -> True,
  AxesOrigin -> {0, 0}
  ]
errorlogplot = ErrorListPlot[
  Partition[
   Riffle[logdata, ErrorBar /@ Transpose[{errordown, errorup}]], 2],
  Joined -> True,
  AxesOrigin -> {0, 0}
  ]
errorlogplot2 = ErrorListPlot[
  Partition[
   Riffle[logdata, ErrorBar /@ Transpose[{errordown, errorup}]], 2],
  Joined -> True,
  AxesOrigin -> {0, 0},
  Ticks -> (Ticks /. AbsoluteOptions@logplot)
  ]
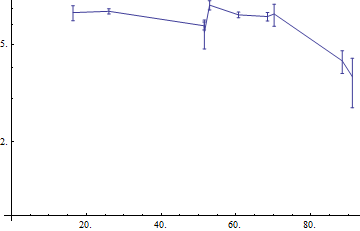
Mathematica graphics

Is there an easy way to do this?

On the log scale the error bars will appear asymmetrical.

$\endgroup$
4
  • $\begingroup$ Have you tried LevelScheme? It's CustomTicks package is a superior alternative to trying to set it up by hand. The edition I have installed isn't functioning correctly, otherwise I would have posted it as an answer. But, it is worth a look. $\endgroup$
    – rcollyer
    Commented Apr 4, 2012 at 3:58
  • 2
    $\begingroup$ Do you realize that 2 of your error bars on 1st plot have negative y-values? I guess it is an accident of making up a random data set, yet we should be aware of these logs of negative values. $\endgroup$ Commented Apr 4, 2012 at 7:53
  • 1
    $\begingroup$ @Vitaliy Kaurov, I realized that after I played with my random data more. I was originally working with a real dataset but it was simpler to post a line to generate random data then upload and link to the real data, however, my random data was slightly broken as you noticed. $\endgroup$
    – s0rce
    Commented Apr 4, 2012 at 19:30
  • $\begingroup$ Unfortunately horizontal error bars are not discussed. $\endgroup$ Commented Mar 22, 2017 at 12:10

5 Answers 5

20
$\begingroup$

I always use the package ErrorBarLogPlots. From the website:

ErrorBarLogPlots.m is a package which adds log-scale plotting functions similar to the standard ErrorListPlot provided in Mathematica 6. The added functions are ErrorListLogPlot, ErrorListLogLinearPlot, and ErrorListLogLogPlot."

$\endgroup$
6
  • $\begingroup$ Strange...Once I write: Needs["ErrorBarLogPlots.m´"], I get the following error: Needs::cxt: Invalid context specified at position 1 in Needs[ErrorBarLogPlots.m\.b4]. A context must consist of valid symbol names separated by and ending with `. >> ... Am I doing something wrong? $\endgroup$
    – Lady InRed
    Commented Nov 30, 2012 at 13:35
  • $\begingroup$ @AnastasiiaAnishchenko Just write Needs["ErrorBarLogPlots`"]. $\endgroup$ Commented Nov 30, 2012 at 17:58
  • $\begingroup$ this doesn't work either...does one have to install anything in addition? I get this message: Needs::nocont: Context ErrorBarLogPlots` was not created when Needs was evaluated. >> $\endgroup$
    – Lady InRed
    Commented Dec 3, 2012 at 14:21
  • $\begingroup$ @AnastasiiaAnishchenko Hmm, I don't get this error. Have you installed the package? Here is the [link]( library.wolfram.com/infocenter/MathSource/6747) . Download the zip file and install it, then retry the Needs command. $\endgroup$ Commented Dec 4, 2012 at 9:40
  • 1
    $\begingroup$ This solution may no longer work correctly in version 8 and above, as suggested in this question $\endgroup$
    – Jens
    Commented Aug 16, 2013 at 17:36
30
$\begingroup$

Without using the "ErrorBarPlots`" Package

dataX = Sort@RandomReal[1, 10];
dataY = RandomReal[{0.5, 1}, 10];
error = RandomReal[0.5, 10];
errorH = dataY + error;
errorL = dataY - error;
f[y_] := Transpose[{dataX, y}];

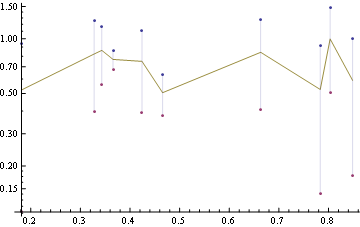
ListLogPlot[{f[errorH], f[errorL], f[dataY]}, 
            Filling -> {1 -> {2}}, 
            Joined -> {False, False, True}]

enter image description here

Edit

Following @rcollyer's suggestion

dataX = Sort@RandomReal[1, 10];
dataY = RandomReal[{0.5, 1}, 10];
error = RandomReal[0.5, 10];
f[y_] := Transpose[{dataX, y}];

PlusMinus[a_, b_] := {a + b, a - b, a};
plusMinList = Thread[PlusMinus[dataY, error]];

ePlot[plotFun_, dataX_, plusMinList_] :=
 plotFun[{
   f[plusMinList[[All, 1]]],
   f[plusMinList[[All, 2]]],
   f[plusMinList[[All, 3]]]},
  Filling -> {1 -> {2}},
  Joined -> {False, False, True}]
ePlot[ListLogPlot, dataX, plusMinList]
$\endgroup$
9
  • 1
    $\begingroup$ @rcollyer Thanks! Filling is widely supported by almost all Plotting primitives. I use it always to draw error bars. $\endgroup$ Commented Apr 4, 2012 at 14:59
  • $\begingroup$ This could easily be transformed into a function that accepts the form {_, PlusMinus[_,_} and plots it on the plotting function of your choice: ListPlot, ListLogPlot, etc. $\endgroup$
    – rcollyer
    Commented Apr 4, 2012 at 15:05
  • $\begingroup$ @rcollyer Done :) $\endgroup$ Commented Apr 4, 2012 at 15:57
  • $\begingroup$ I'd put PlusMinus inside of a Block to prevent corrupting Global` , and accept d:{{_, PlusMinus[_,_]}..}. $\endgroup$
    – rcollyer
    Commented Apr 4, 2012 at 16:37
  • 4
    $\begingroup$ Nice! If more traditional error bars are desirable, options can be added: ListLogPlot[..., PlotMarkers -> {"-", "-", "\[FilledCircle]"}] $\endgroup$ Commented Apr 4, 2012 at 17:34
23
$\begingroup$

A one-liner solution (see a bit below lengthy explanation)

This is a bit hacky solution, yet its simplicity prompted me to post it. Load package and make up a data set:

Needs["ErrorBarPlots`"]
data = Sort@RandomReal[1, {10, 2}]; error = RandomReal[0.2, 10];

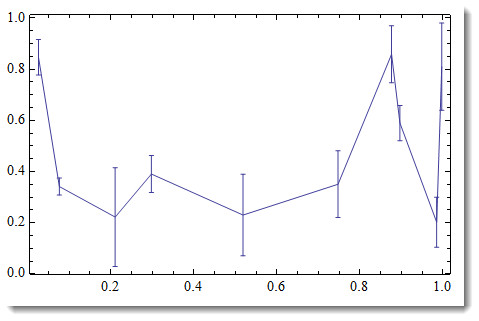
errorplot = ErrorListPlot[Partition[Riffle[data, ErrorBar /@ error], 2], 
            Joined -> True, PlotRange -> All, Frame -> True, Axes -> False]

enter image description here

IMPORTANT: nothing goes below x-axis - not the data, not the error bars. Otherwise your log-scale will break - you cannot take log of negative numbers.

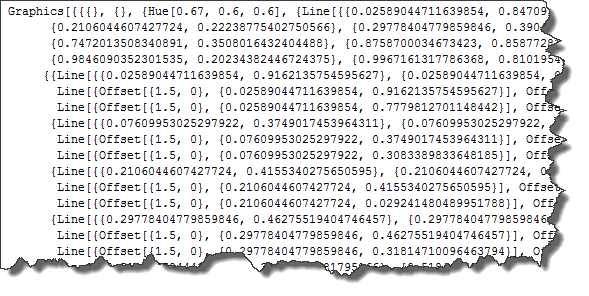
Now lets take a look at the "guts" of the produced graphics:

errorplot // InputForm

enter image description here

Line graphics primitive (sometimes with Offset) applied to sets of points given by coordinates like {x, y}. You just need to replace all these pairs by {x, Log@y}. Careful with Offset - its 1st argument needs to be left a lone. Luckily for us it has an integer 0 so it is easy to avoid applying a pattern that distinguishes it from real numbers we need to deal with.

So here is your one-liner solution:

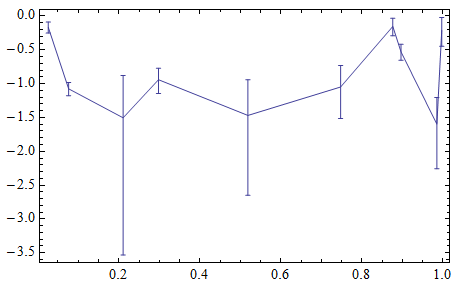
lerrorplot = errorplot /. {x_Real, y_Real} -> {x, Log@y}

enter image description here

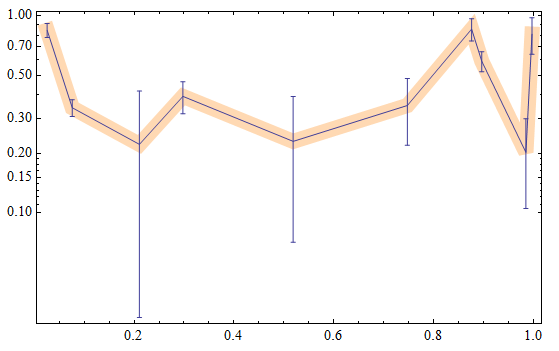
Notice undesirable non-standard ticks on vertical axes (corresponding to log values). To check that it is indeed correct - compare versus ListLogPlot:

check = ListLogPlot[data, Joined -> True, Frame -> True, 
Axes -> False, PlotStyle -> {Thickness[.03], Orange, Opacity[.3]}];
Show[check, lerrorplot, PlotRange -> All]

enter image description here

A perfect match. Notice the ticks on vertical axes now are in traditional log-scale type (corresponding to original un-scaled data). Of course, your error bars got log-scaled too. Warning: be careful with these ReplaceAll type of solutions - you may be up to a surprise to what exactly is getting replaced. So always analyse your code to avoid unpleasant urprises.

$\endgroup$
4
  • $\begingroup$ +1, for a straightforward solution. Looking at the code for ErrorListPlot, it uses ReplaceAll to effect its changes. Although it is a little more thorough and discriminating in it's approach. $\endgroup$
    – rcollyer
    Commented Apr 4, 2012 at 13:31
  • $\begingroup$ Nice answer. BTW I liked the ripped-out look of your InputForm picture; Mathematica? It's ideal for pictures that have to convey the message "There's more of this, but that's not important". $\endgroup$ Commented Apr 4, 2012 at 13:40
  • $\begingroup$ @SjoerdC.deVries I use the software is called Snagit. It'd be cool to implement it in Mathematica. $\endgroup$ Commented Apr 4, 2012 at 16:30
  • $\begingroup$ Thanks very much, I ended up using the ErrorBarLogPlot package linked by @Markus Roellig since in the end I need a log-log plot. I tried lerrorplot = errorplot /. {x_Real, y_Real} -> {Log@x, Log@y} but I just got a green box. $\endgroup$
    – s0rce
    Commented Apr 4, 2012 at 19:25
5
$\begingroup$

According to solution of Dr. Belisarius I wrote this more convenient code:

(* default options needed for error plot *)
Options[errListPlot] = {
   Filling -> {1 -> {2}},
   Joined -> {False, False, True},
   PlotStyle -> {Black, Black, Directive[Opacity[0.6], Blue]},
   FillingStyle -> Black,
   PlotMarkers -> {Graphics@Line[.04 {{-1, 0}, {1, 0}}], 
     Graphics@Line[.04 {{-1, 0}, {1, 0}}], ""}
   };
(*
plotFun - any ListPlot familly function;
data =List ( x, y, error );
opts - usual ListPlot options;
*)
errListPlot[plotFun_, data_, opts : OptionsPattern[]] := Block[{},
  plotFun[{{#[[1]], #[[2]] - #[[3]]} & /@ 
     data, {#[[1]], #[[2]] + #[[3]]} & /@ data, data[[;; , {1, 2}]]}, 
   opts, Sequence @@ Options[errListPlot]]
  ]
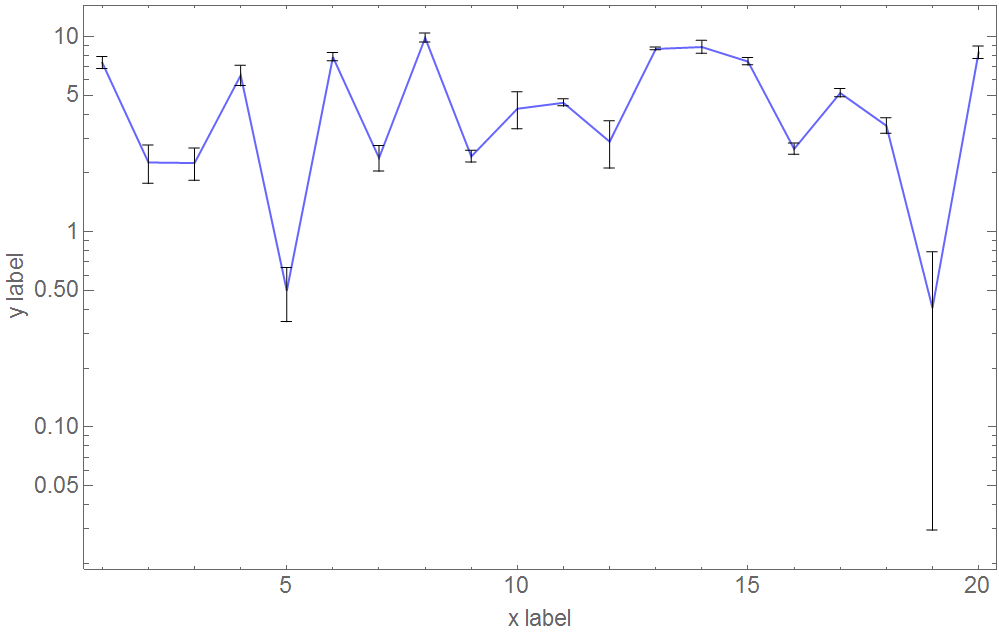
data = Table[{i, RandomReal[10], RandomReal[{0.1, 1}]}, {i, 1, 20}];
errListPlot[ListLogPlot, data, PlotRange -> All, Frame -> True, 
 FrameLabel -> {"x label", "y label"}, ImageSize -> 800, 
 BaseStyle -> {18, FontFamily -> "Arial"}]

Resulting plot with error bars First I set necessary options for the plot with Options[errListPlot]. Then the plot function is defined with option pattern. Supplied options will be given to targeted List-XXX-Plot function and applied to the graphics.

Be careful, supplied option will overwrite default options from Options[errListPlot]. This can be useful if you do it right or catastrophic.

$\endgroup$
3
  • 1
    $\begingroup$ The question requested that the y-axis be logarithmic, not the x-axis. $\endgroup$
    – bbgodfrey
    Commented Jul 22, 2016 at 17:06
  • 1
    $\begingroup$ This solution works for any combination of log, loglog, loglinear, linearlog plots. Example ListLogPlot: errListPlot[ListLogPlot, data]. $\endgroup$
    – drgrujic
    Commented Jul 25, 2016 at 15:23
  • 1
    $\begingroup$ In that case, you may wish to edit your answer to include a figure that responds directly to the question. Doing so would make your answer more useful to others. Best wishes. $\endgroup$
    – bbgodfrey
    Commented Jul 25, 2016 at 15:35
5
$\begingroup$

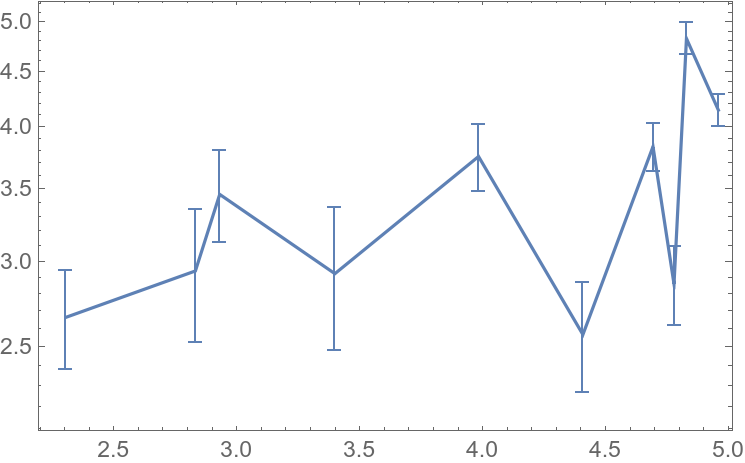
In Mathematica 12, the ErrorBarPlots package was replaced by the built-in Around function and related methods.

Now it's possible to display errorbars on a logarithmic plot using only built-in core functions and the ListLogPlot function:

data = Sort@RandomReal[{2, 5}, {10, 2}];
error = RandomReal[0.5, 10];
toPlot = MapThread[({#1[[1]], Around[#1[[2]], #2]}) &, {data, 
    error}];
ListLogPlot[toPlot, Joined -> True, Frame -> True]

$\endgroup$
2
  • $\begingroup$ Unfortunately, this will always plot the absolute uncertainties. In Log-scale it is common to plot the relative error to avoid funny artifacts. ErrorBarLogPlots automatically took care of this. Does anybody found a similar functionality in V12? $\endgroup$ Commented Apr 29, 2019 at 14:56
  • 1
    $\begingroup$ @MarkusRoellig By relative uncertainty you mean ±5% for example? If so, you can use Around[x, Scaled[0.05]]. $\endgroup$
    – balping
    Commented Apr 30, 2019 at 17:23

Your Answer

By clicking “Post Your Answer”, you agree to our terms of service and acknowledge you have read our privacy policy.

Not the answer you're looking for? Browse other questions tagged or ask your own question.