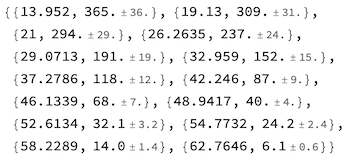
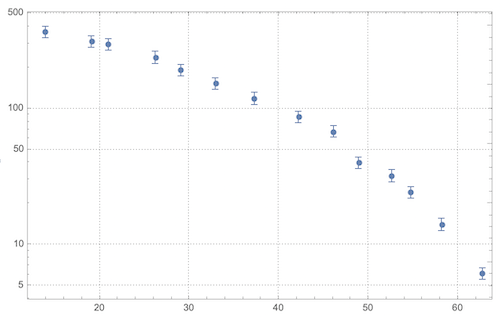
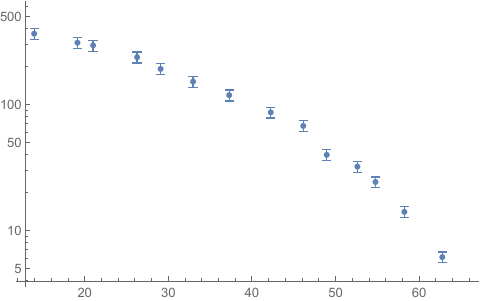
I want to draw those data with ErrorBar and the Y-axis must be in Log scale
Derivative[1][HoldForm[Get["ErrorBarLogPlots"]]]
B = ErrorListLogPlot[{{{13.952, 364.7},ErrorBar[36.4]}, {{19.13, 309.11},ErrorBar[30.9]}, {{21, 294.159},ErrorBar[29.4]}, {{26.2635, 237.26},ErrorBar[23.7]}, {{29.0713, 191.367},ErrorBar[19.1]}, {{32.959, 151.82},ErrorBar[15.1]}, {{37.2786, 118.47},ErrorBar[11.8]}, {{42.246, 86.529},ErrorBar[8.6]}, {{46.1339, 67.5217},ErrorBar[6.7]}, {{48.9417, 39.7778},ErrorBar[3.9]}, {{52.6134, 32.0836}, ErrorBar[3.2]}, {{54.7732, 24.2215},ErrorBar[2.4]}, {{58.2289, 14.0352},ErrorBar[1.4]}, {{62.7646, 6.13975}, ErrorBar[0.6]}, PlotRange -> {{0, 130}, {10^-2, 10^3}}, Frame -> True,FrameLabel -> {"cm", "(mb)"},LabelStyle -> Directive[Bold, Medium],PlotLegends -> Placed[{"(Exp"}, {.7, .65}],PlotStyle -> Directive[Blue, Medium]]


