2
$\begingroup$

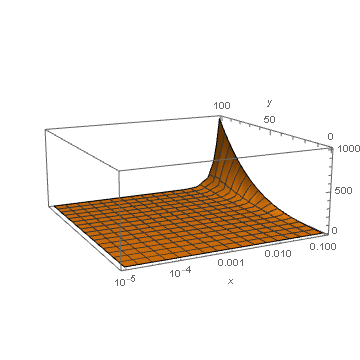
Let's say I want to plot a function $f(x,y)= x^3 y^3 + e^{-x}$ using 3D plot; x runs from 0.00001 to 0.1 and y runs from 1 to 100. Now, I want to have a logarithmic scale along the x-axis. So, how to do that?

I used the following command for 3D plot:

Plot3D[x^3 y^3 + Exp[-x], {x, 0.00001, 0.1}, {y, 1, 100}]
$\endgroup$
1
  • 7
    $\begingroup$ Use ScalingFunctions -> {"Log", None, None} $\endgroup$
    – Carl Woll
    Commented Apr 4, 2019 at 6:25

2 Answers 2

3
$\begingroup$

As mentioned by Carl Woll in comments, the easiest way it to use the ScalingFunctions option to Plot3D:

Plot3D[
  x^3 y^3 + Exp[-x], {x, 0.00001, 0.1}, {y, 1, 100},
  ScalingFunctions -> {"Log", None, None},
  PlotRange -> All, AxesLabel -> Automatic
]

Mathematica graphics

$\endgroup$
0
$\begingroup$

Try

ParametricPlot3D[{Log[x], y, x^3 y^3 + Exp[-x]},{x, 0.00001,0.1}, {y, 1, 100}, BoxRatios -> 1]
$\endgroup$

Your Answer

By clicking “Post Your Answer”, you agree to our terms of service and acknowledge you have read our privacy policy.

Not the answer you're looking for? Browse other questions tagged or ask your own question.