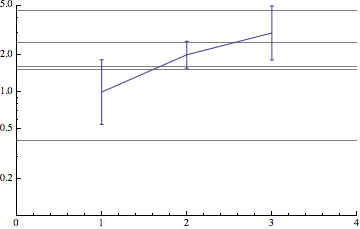
From this and this post I learned how to use ErrorListLogPlot and its family to add error bars on top of a list of mean values. However, consider this simple example:
Needs["ErrorBarLogPlots`"]

ErrorListLogPlot[{{1, 0.6}, {2, 0.5}, {3, 1.5}}, Joined -> True,
PlotRange -> {{0, 4}, {0.1, 5}},
GridLines -> {{}, {0.4, 1.5, 1.6, 2.5, 4.5}}]

where {1, 2, 3} are mean values and {0.6, 0.5, 1.5} are the associated standard errors. I added GridLines to indicate the positions where the end points of error bars are supposed to be located. It is clear from the plot above that the gridlines and end points do not intersect (on Mathematica 9), so the error bars must be wrong. I wonder whether something can be fixed in the ErrorBarLogPlots package. Note that the following examples, including built-in ErrorListPlot, give correct error bars (either on linear or log scale):
ErrorListPlot[{{1, 0.6}, {2, 0.5}, {3, 1.5}}, Joined -> True,
PlotRange -> {{0, 4}, {0.1, 5}},
GridLines -> {{}, {0.4, 1.5, 1.6, 2.5, 4.5}}]

ListPlot[{{1, 2, 3}, {0.4, 1.5, 1.5}, {1.6, 2.5, 4.5}},
Joined -> {False, True, True}, PlotRange -> {{0, 4}, {0.1, 5}},
GridLines -> {{}, {0.4, 1.5, 1.6, 2.5, 4.5}},
Filling -> {2 -> {3}}]

ListLogPlot[{{1, 2, 3}, {0.4, 1.5, 1.5}, {1.6, 2.5, 4.5}},
Joined -> {False, True, True}, PlotRange -> {{0, 4}, {0.1, 5}},
GridLines -> {{}, {0.4, 1.5, 1.6, 2.5, 4.5}},
Filling -> {2 -> {3}}]
