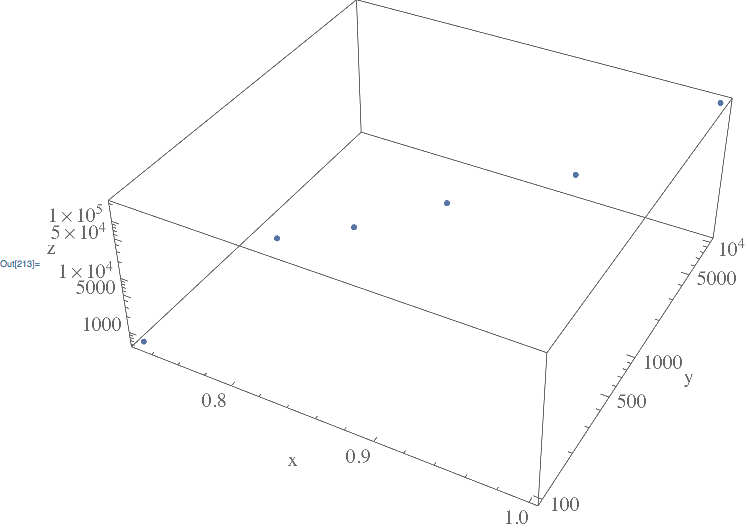
I've been trying to get my y and z axes log-scaled on a 3D list Point Plot, for example (test data):
data={{.73,100,600},{.75,800,900},{.8,1100,2000},{.85,2100,4000},{.92,5000,9000},{1,10000,200000}};

ListPointPlot3D[data, AxesLabel -> {"x", "y", "z"},
 BaseStyle -> {FontSize -> 30, FontFamily -> "Times"},
 LabelStyle -> Black, ImageSize -> 1000
 ]
I have tried everything I could find in old posts, but everything seemed to be geared towards Plot3D - and doesn't seem to work for ListPointPlot3D.
Any suggestions? Thanks so much!

