It would be good to see what definition you're using for errorPlot as I obviously cannot run your code to see what issues you're having. That being said, one way to change the default setting for the range is this:
SetOptions[ListPlot, PlotRange -> {{minX, maxX}, {minY, maxY}}];
You can do this for each of ListPlot, ListLogPlot, ListLogLogPlot, and ListLogLinearPlot. This isn't the cleanest way as it changes the default until you start a new Notebook/Kernel, but it works if you really don't want to use the standard method of calling ListPlot and friends, which would be:
ListPlot[
    data,
    PlotRange -> {{minX, maxX}, {minY, maxY}}]
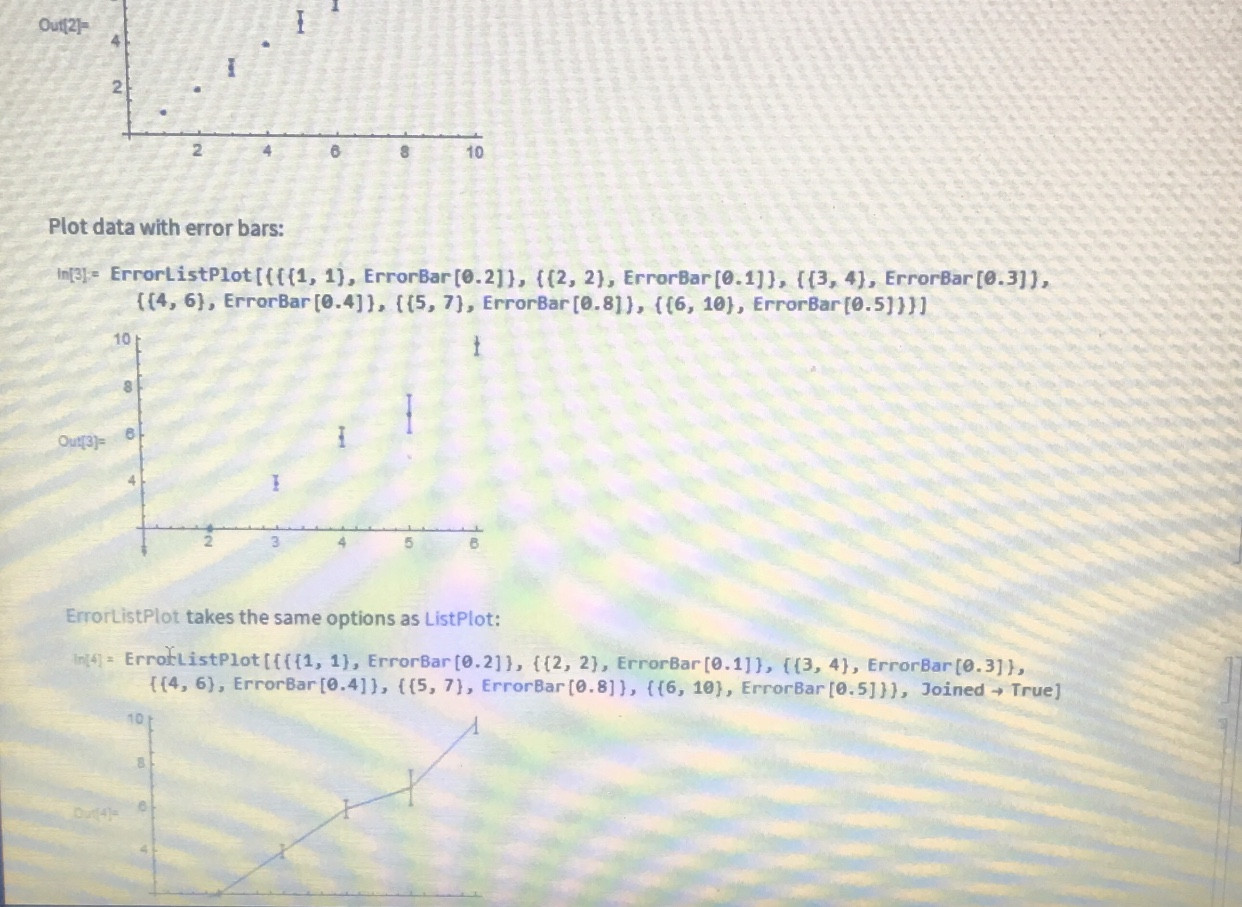
In order to get error bars on a ListPlot, we can use the ErrorBarPlots package. The ErrorListPlot function is expecting input in the form of:
{
 {{x1, y1}, ErrorBar[{-x1error, +x1error}, {-y1error, +y1 error}]},
 {{x2, y2}, ErrorBar[{-x2error, +x2error}, {-y2error, +y2error}]},
 ...
}
This is what my Table for errorData is for. It takes your variables, rearranges them into the format expected by ErrorListPlot, and makes sure the first number in each error bar is negative. We can call the following code:
Needs["ErrorBarPlots`"]
data = {{20, 100}, {30, 10}, {100, 1000}, {500, 1000}};
xer = {{10, 10}, {20, 300}, {50, 50}, {100, 200}};
yer = {{50, 50}, {5, 50}, {100, 500}, {300, 100}};

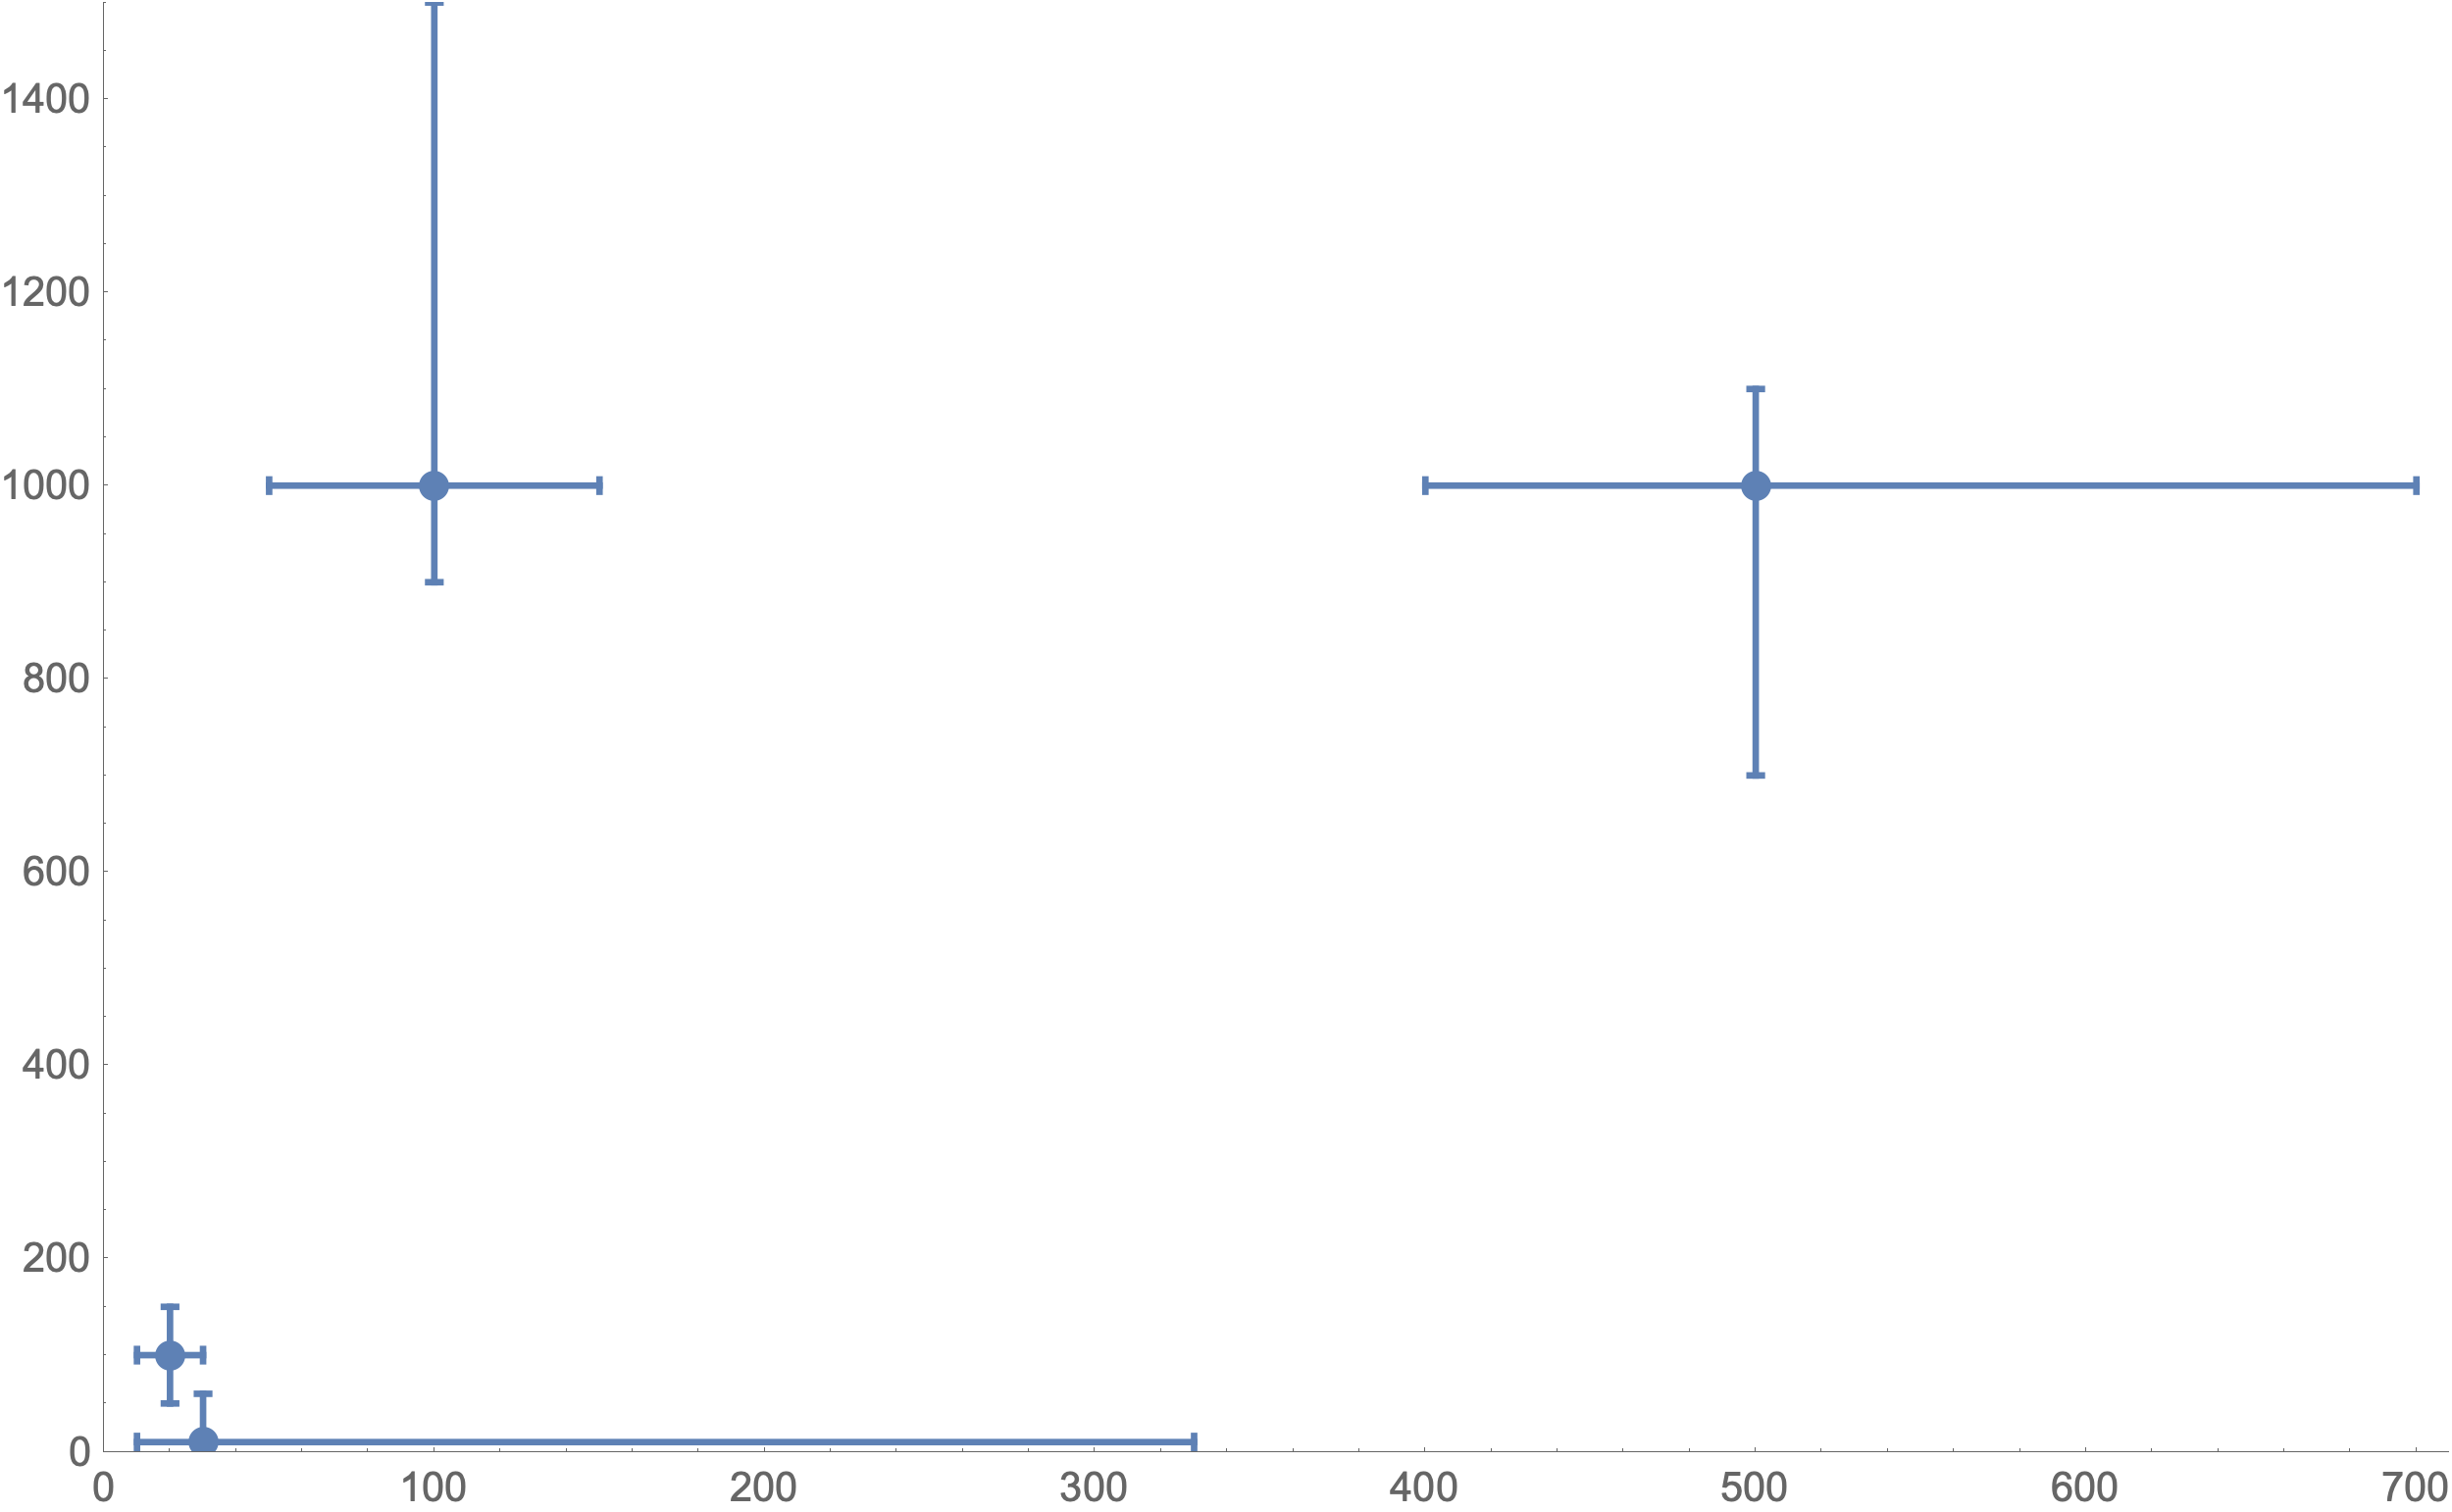
errorData = Table[{data[[i]], ErrorBar[xer[[i]] * {-1, 1}, yer[[i]] * {-1, 1}]}, {i, Length[data]}]

ErrorListPlot[
    errorData,
    PlotRange -> {{0, 710}, {0, 1500}}]
This should get us a plot that looks like this:

Unfortunately, the error bar plotting package in Mathematica is not especially robust and there are no equivalents for Log, LogLinear, and LogLog Plots. However, the following post has some great workarounds so I won't bother restating them here:
Plotting Error Bars on a Log Scale


