14
$\begingroup$

There are several answers where Mathematica used mesh points to show graphically where curve intersections exist.

For example: Marking points of intersection between two curves or Is there a better way to get the eight points of intersection?

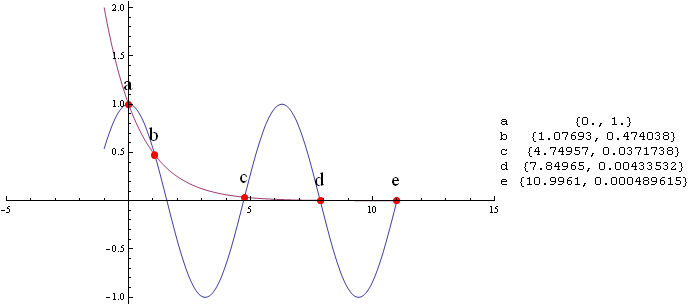
Is there a way to include the actual point values (maybe they are simply labeled as a, b, c ...) and then the actual value is displayed on the right of the graphic?

Here is the specific example I am working.

Plot[{Cos[x],(1/2)^x},{x,-1,11},
 PlotPoints->84,
 MaxRecursion->9,
 MeshFunctions->{Cos[#1]-(1/2)^#1&},
 Mesh->{{0}},
 MeshStyle->Directive[Red,PointSize[Large]]]
$\endgroup$
3
  • 1
    $\begingroup$ You can put Graphics[Text[#, #] & /@ coords] to the Show or just Text part to the Epilog. $\endgroup$
    – Kuba
    Commented Sep 11, 2013 at 6:09
  • 1
    $\begingroup$ @Kuba ... and with small offset on the coordinate part of Text, it's positioned next to the point itself, not on top of it. $\endgroup$
    – kirma
    Commented Sep 11, 2013 at 6:41
  • 1
    $\begingroup$ lines meet at solutions of two lines equations..may be you want to find solutions first and them use Text as suggested to get only relevant info. $\endgroup$ Commented Sep 11, 2013 at 6:55

3 Answers 3

15
$\begingroup$
opts = {ImageSize -> 500, PlotRange -> {{-5, 15}, All}, PlotPoints -> 84,
        MaxRecursion -> 9, MeshFunctions -> {Cos[#1] - (1/2)^#1 &}, Mesh -> {{0}}, 
        MeshStyle -> {Directive[Red, PointSize[Large]]}};

You may be interested in the fact that Mesh solution is good for visulatisation purposes but it seems that coordinates given with this method are only approximation.

Also there are double points, one for each curve and each aproximation is independent what may result in different coordinates.

Taking your example let's label those points:

(Plot[{Cos[x], (1/2)^x}, {x, -1, 11}, Evaluate@opts] // Normal
) /. Point[x_] :> ({Point@x,
                    Text[Style[NumberForm[#, {Infinity, 2}], Bold, Black, 15] &@x
                         , x + {0, .5 - RandomReal[]/2}]})

It basically replaces points with points + labels. Labels are with random offset so you can see what I was reffering to. Normal is in order to get rid of the GraphicsComplex. enter image description here
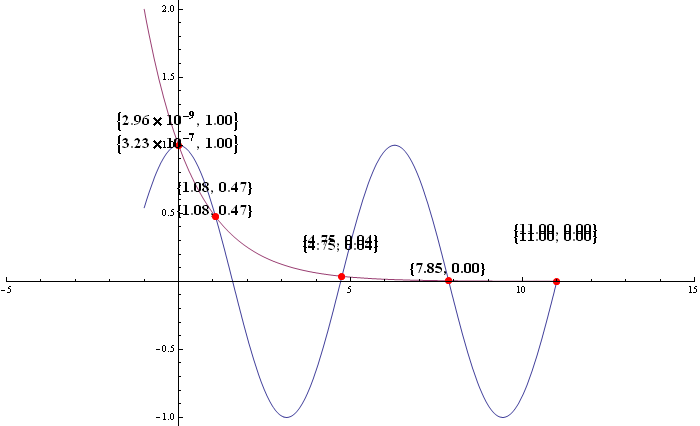
As you can see, the mesh point near $y$ axis has different coordinates :)


Edit So at the end I would use NSolve based solution like in the first link you've provided:

After all I forgot you asked for the legend next to the plot :)

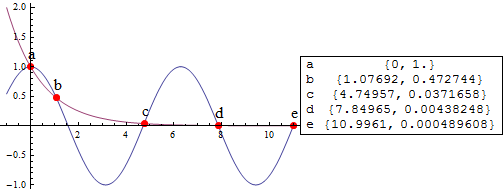
points = {x, Cos[x]} /. NSolve[Cos[x] == (1/2)^x && -1 < x < 11, x];
names = FromCharacterCode /@ (Range[Length@points]+96)
{"a", "b", "c", "d", "e"}
 Row[{
      Plot[{Cos[x], (1/2)^x}, {x, -1, 11}, Evaluate@opts, 
          Epilog -> (Text[Style[#, 20], #2 + {0, .2}] & @@@ Transpose[{names, points}])
          ]
      ,
      Grid@MapThread[List, {names, points}]
    }]
enter image description here

$\endgroup$
3
  • $\begingroup$ I know it's an old question / answer, but I need to understand why, in your first solution, there are double coordinates at each intersection point? $\endgroup$
    – Conrad
    Commented Sep 8, 2015 at 15:56
  • $\begingroup$ @Conrad I'm not sure but it seems it is what I;ve said. Mesh points are generated separately for each curve, maybe to be sure that everything is covered if one curve is problematic or something. $\endgroup$
    – Kuba
    Commented Sep 8, 2015 at 18:42
  • $\begingroup$ Ok, so your second solution (using NSolve) is preferable. But how would you manage intersection with several curves (Cos[x], Sin[x], Tan[x])? The syntax would become much more complex? $\endgroup$
    – Conrad
    Commented Sep 9, 2015 at 12:49
8
$\begingroup$

DisplayFunction

Using a custom DisplayFunction that injects labels as locators for the mesh points:

ClearAll[displayF]
displayF[offset_: {20, 20}] := (Normal[#] /. 
   p : {__Point} :> (Point /@ DeleteDuplicates[p[[All, 1]], 
       Round[#, .1] == Round[#2, .1] &]) /.  
   Point[x_] :> {Point[x], Locator[Offset[offset, x], 
       Framed[Column @ Round[x, .0001], FrameStyle -> None,  
         Background -> Opacity[.5, Yellow]]]} &);

Examples:

Plot[{Cos[x], (1/2)^x}, {x, -1, 11}, PlotPoints -> 84, 
 MaxRecursion -> 9, MeshFunctions -> {Cos[#1] - (1/2)^#1 &}, 
 Mesh -> {{0}}, MeshStyle -> Directive[Red, PointSize[Large]], 
 PlotRangeClipping -> False, ImageSize -> 600, ImagePadding -> 70, 
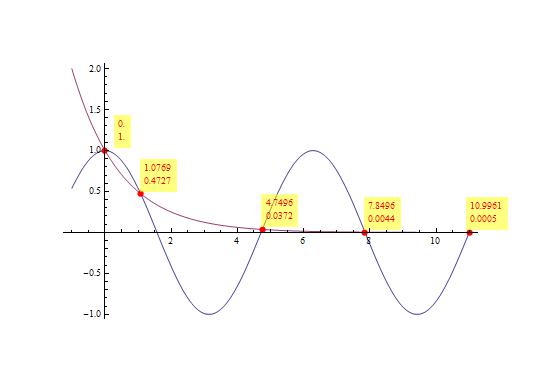
 DisplayFunction -> displayF[]]

enter image description here

Plot[{x Sin[x], x Cos[x]}, {x, -1, 11}, PlotPoints -> 150, 
 MaxRecursion -> 9, MeshFunctions -> {# Sin[#] - # Cos[#] &}, 
 Mesh -> {{0}}, MeshStyle -> Directive[Red, PointSize[Large]], 
 PlotRangeClipping -> False, ImageSize -> 600, ImagePadding -> 70, 
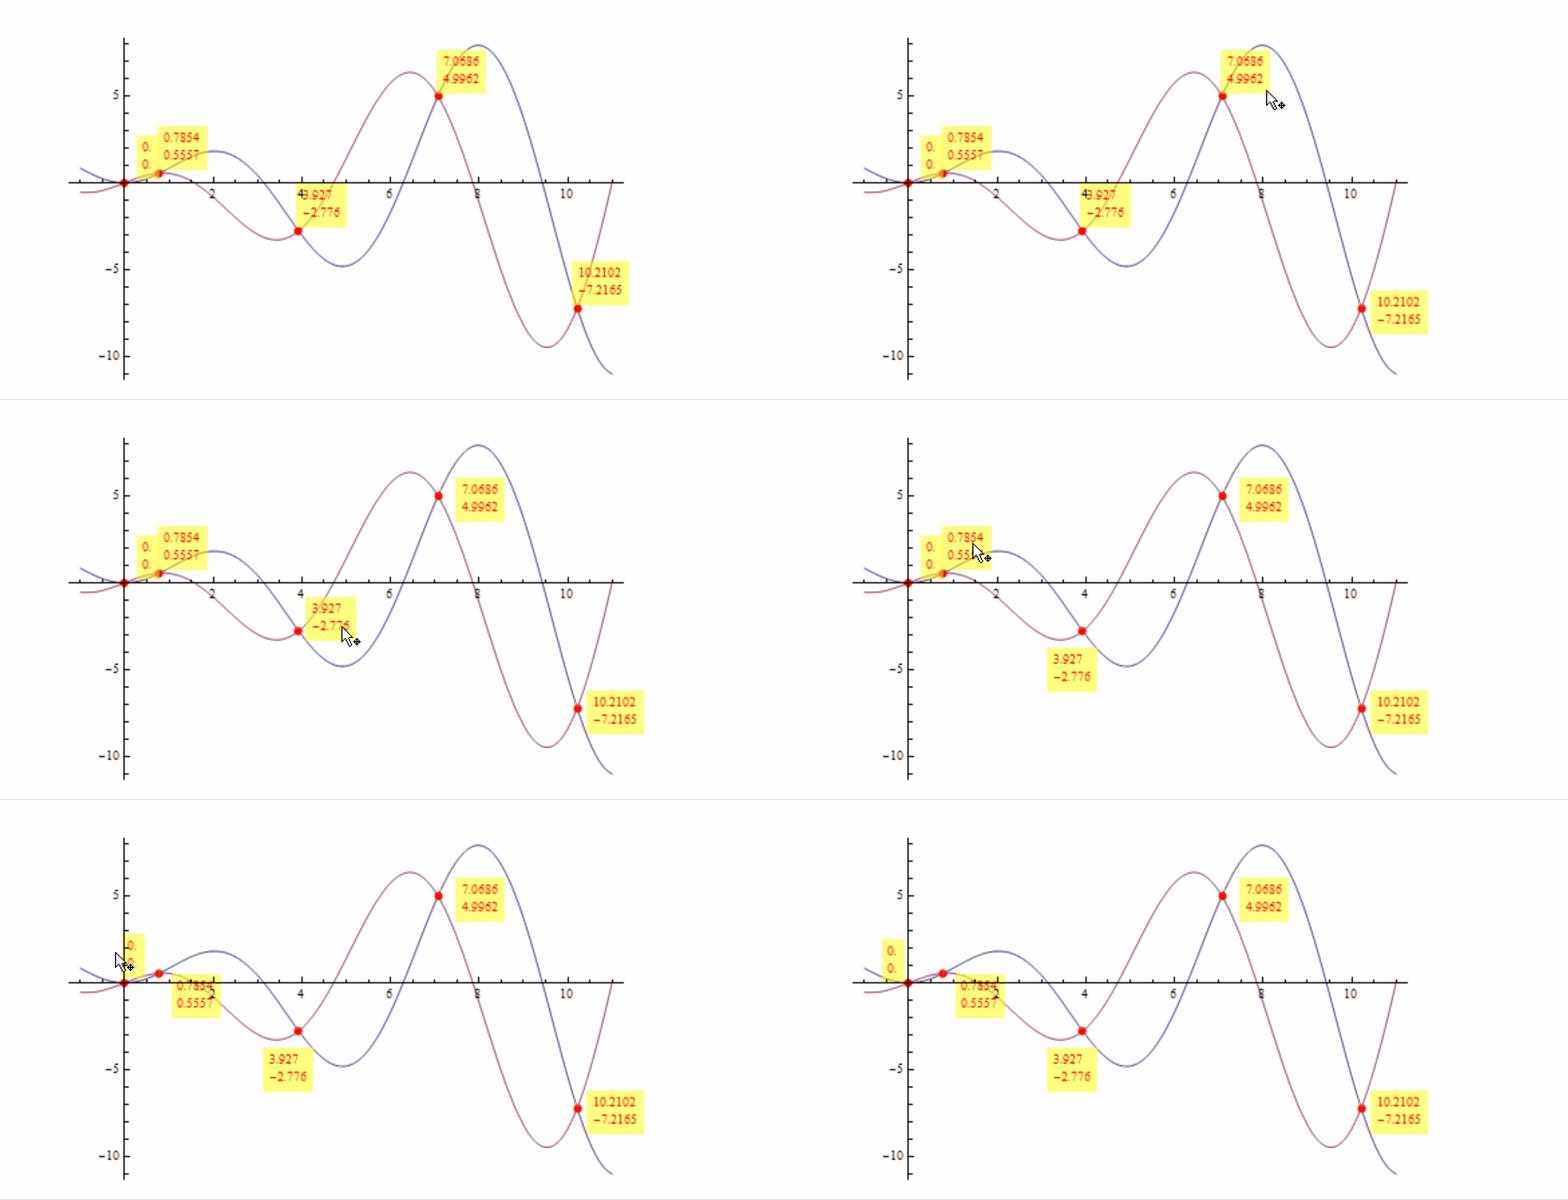
 DisplayFunction -> displayF[]]

enter image description here

$\endgroup$
7
$\begingroup$

Perhaps ugly but may achieve what you want:

p = Plot[{Cos[x], (1/2)^x}, {x, -1, 11}, PlotPoints -> 84, 
  MaxRecursion -> 9, MeshFunctions -> {Cos[#1] - (1/2)^#1 &}, 
  Mesh -> {{0}}, MeshStyle -> Directive[Red, PointSize[Large]], 
  ImageSize -> 300]

Extract intersection points (which as described are approximates with duplicates):

intp = Extract[p[[1, 1]], List /@ p[[1, 2, 2, 1, 2, 1]]]

"Clean" and sort (by removing "same" x value) and create labels:

sorted = Chop[#, 10^(-8)] & /@ 
  SortBy[DeleteDuplicates[intp, 
    Chop[#1[[1]] - #2[[1]], 10^(-4)] == 0 &], #[[1]] &]
labels = FromCharacterCode /@ (96 + Range[Length[sorted]])

Display:

Row[{
  Show[p, 
   Graphics[
    MapThread[
     Text[Style[#1, 16], #2 + {0.1, 0.2}] &, {labels, sorted}]]],
  Grid[Transpose[{labels, sorted}], Frame -> True]
  }]

yields:

enter image description here

$\endgroup$
3
  • 1
    $\begingroup$ I'm not sure if the way that you are getting intp is safe enough to be used always, maybe you can use something like: Cases[p, GraphicsComplex[x_, ___] :> Part[x, First@Cases[p, Point[z_] :> z, \[Infinity]]], \[Infinity]] $\endgroup$
    – Kuba
    Commented Sep 11, 2013 at 8:30
  • $\begingroup$ @Kuba Thank you, I agree entirely that this is not general and just an interrogation and dissection of the GraphicsComplex. I just wished to show that you can access the points. I regard this as ugly but hoped that comments such as yours would arise. Thank you for the more general method...I have learned something. $\endgroup$
    – ubpdqn
    Commented Sep 11, 2013 at 8:39
  • $\begingroup$ I'm glad you find it useful. :) $\endgroup$
    – Kuba
    Commented Sep 11, 2013 at 8:43

Your Answer

By clicking “Post Your Answer”, you agree to our terms of service and acknowledge you have read our privacy policy.

Not the answer you're looking for? Browse other questions tagged or ask your own question.