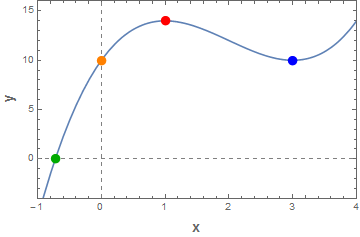
Is there any way that I can label/mark points (axes intercepts, maximum/minimum values etc.) on Mathematica? (as in without using the drawing tools)
Such as in the case of: Plot[{x^3 - 6*x^2 + 9*x + 10}, {x, 0, 4}]
Thanks
Here is an example of some of the things you could do using Epilog, which essentially allows you to combine any 2D graphics primitives on top of an existing plot.
I will define your function as fun[x]:
Clear[fun, realzero]
fun[x_] := x^3 - 6*x^2 + 9*x + 10
I can use Solve to find the function's zeroes, i.e. its intersections with the horizontal axis:
realzero = {x, 0} /. First@Solve[fun[x] == 0., x, Reals]

(* Out: {-0.721892, 0} *)
I then have Mathematica calculate the expression's first derivative and set up an equation to find its zeroes, i.e. the function's extrema.
Solve[D[fun[x], x] == 0, x]

(* Out: {{x -> 1}, {x -> 3}} *)
I can then combine what I found in a plot:
Plot[fun[x], {x, -1, 4},
 Epilog -> {PointSize[0.03],
   Red, Tooltip[#, #[[1]]] &@Point[{1, fun[1]}],
   Blue, Tooltip[#, #[[1]]] &@Point[{3, fun[3]}],
   Darker@Green, Tooltip[#, #[[1]]] &@Point[realzero],
   Orange, Tooltip[#, #[[1]]] &@Point[{0, fun[0]}]
   },
 AxesStyle -> Directive[Gray, Dashed], AxesOrigin -> {0, 0},
 PlotRange -> {Automatic, {-4, All}},
 PlotRangePadding -> {None, {0, Scaled[0.1]}},
 Frame -> True,
 FrameLabel -> (Style[#, Bold, FontSize -> 14] & /@ {"x", "y"})
]

If you execute the code in Mathematica and hover over those points with the mouse, you will also notice that a tooltip pops up with the coordinates for those points.
I would suggest that you use this code as a starting point to explore the commands and options showcased: play around with it, modify it, dig into the documentation... Mathematica can be a lot of fun!
Epilogto add whatever you want, but you have to calculate those point's positions. Related: Labeling points of intersection between plots $\endgroup$Epilogto Mathematica notebook, press F1 :) $\endgroup$Epilogdoes contain the examples you are after, so the pointer provided by Kuba is actually enough to answer your question. $\endgroup$