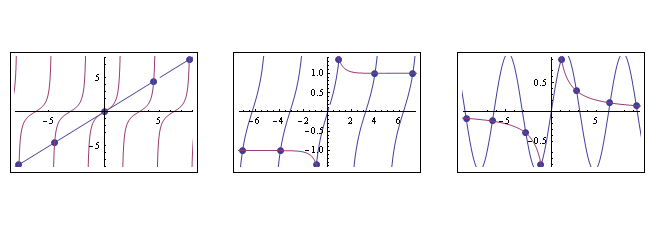
I'm trying to illustrate the solutions numerically and graphically for an equation such as Tan[x] == x. I think I did everything ok except I wanted to mark each intersection between Tan[x] and x.
Does anyone know how such a thing can be done?
Edited to make it a function.
For the strange Exclusions specification I use below, see my answer here. Thanks to @Oleksandr and @JM for their great comments.
plInters[{f1_, f2_}, {min_, max_}] :=
 Module[{sol, x},
         sol = x /. NSolve[f1[x] == f2[x] && min < x < max, x];
         Framed@Show[
                  ListPlot[{#, f1[#]} & /@ sol, PlotStyle -> PointSize[Large]],
                  Plot[{f1[x], f2[x]}, {x, min, max}, Exclusions -> {True, f2[x] == 10, f1[x] == 10}]
    ]
  ]


GraphicsRow[plInters[#, {-10, 10}] & /@ {{# &, Tan}, {Tan, Coth}, {Sin, 1/# &}}]

Plot can sometimes determine exclusions properly and sometimes not. Still, this'll look a bit better if you set Exclusions -> Pi/2 Range[-5, 5, 2] for Plot (otherwise, it may be harder for students to see that these aren't really solutions).
$\endgroup$
Commented
Sep 12, 2012 at 1:45
Update 3: Using Graphics`Mesh`FindIntersections to get the intersection points (see also):
showIntersections =
  Block[{Annotation = # &},
    Show[#, Graphics@{Red, PointSize[Large],
       Point@Graphics`Mesh`FindIntersections@#}]] &;
Using the two examples in the original answer:
Row[showIntersections /@ {Plot[{Cos[x], x Sin[x]}, {x, -3 Pi, 3 Pi},
    ImageSize -> 400],
   Plot[{Tan[x], x Sin[x]}, {x, -3 Pi, 3 Pi}, ImageSize -> 400,
    Exclusions -> Range[-5 Pi/2, 5 Pi/2, Pi]]}]
Original answer:
You can also use MeshFunctions:
  Plot[{Cos[x], x Sin[x]}, {x, -3 Pi, 3 Pi},
     MeshFunctions -> {(Cos[#] - # Sin[#]) &}, Mesh -> {{0}},
     MeshStyle -> Directive[Red, PointSize[Large]]]
![plot of Cos[x] and x Sin[x]](https://i.sstatic.net/W1OJS.png)
Update: Dealing with Tan[x] using Exclusions
Plot[{Tan[x], x Sin[x]}, {x, -3 Pi, 3 Pi},
   MeshFunctions -> {(Tan[#] - # Sin[#]) &}, Mesh -> {{0}},
   MeshStyle -> Directive[Red, PointSize[Large]],
   Exclusions -> Range[-5 Pi/2, 5 Pi/2, Pi]]
   (* or Exclusions -> (Cos[x] == 0) *)
![plot of Tan[x] and x Sin[x]](https://i.sstatic.net/8TB1X.png)
Update 2: Using just Mesh and MeshStyle:
points = NSolve[Tan[x] == x Sin[x] && -3 Pi < x < 3 Pi, x][[All, 1, 2]];
Plot[{Tan[x], x Sin[x]}, {x, -3 Pi, 3 Pi},
  Mesh -> {points},
  MeshStyle -> {Directive[Red, PointSize[Large]]},
  Exclusions -> Range[-5 Pi/2, 5 Pi/2, Pi]]
(* same picture as above *)
excluding the vertical segments of the Tan function (using Exclusions or RegionFunction) MeshFunctions do not work.
$\endgroup$
Comment by the OP (migrated from the question) ->** I'm sorry if I'm not 'commenting' properly. I'll figure it out when I get more time here. I wanted to say THANKS to EVERYONE that posted. This is exactly what I was looking for. I will use all the input and make sure I learn from what was given. What a goldmine this site is for learning something like this. Thanks again, it's greatly appreciated!! $\endgroup$