8
$\begingroup$

I am drawing a curve from a list using:

plot1 = 
ListLinePlot[data, 
Axes -> True, ImageSize -> 200, 
AspectRatio -> 1, 
PlotRange -> {{0, 65}, Automatic}]

data is a list of form {{t0,x0},{t1,x1},...,{tn,xn}}showing time and position of a particle.

And then fitting a curve of the form x = a*t^n using

f = Function[t, a*t^n] /. FindFit[data, a*t^n, {a, n}, t, MaxIterations -> 1000]

    fit1 = 
Plot[f[t], {t, 0, 65}, 
AspectRatio -> 1, ImageSize -> 200, PlotStyle -> Red, 
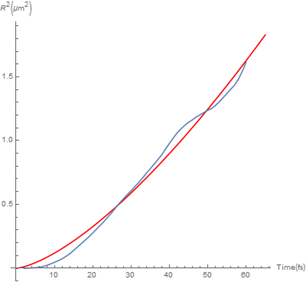
AxesLabel -> {Time[fs], (R^2)[μm^2]}]

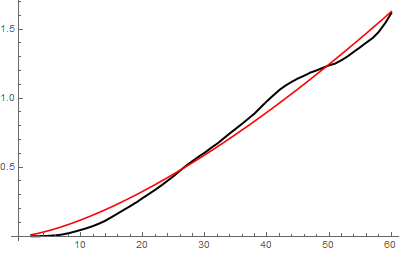
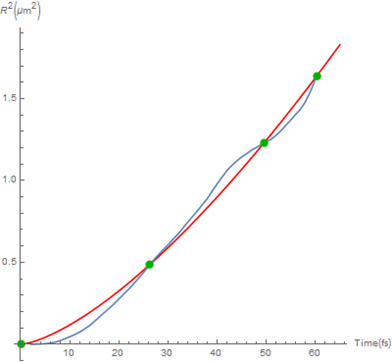
Which gives me two curves and I want to find the intersection points of these graphs

Show[fit1, plot1] 

I have tried using GraphIntersection, Solve, and NSolve but none of which have worked because of the data structure (I can write out my implementation for any of these because I may be using them wrong!). I was wondering if there is a way to do this? The list data is given below. Thanks for your help in advance!

data = {{2.07562, 0.00027459}, {3.01908, 0.000885945}, {3.96254, 0.00188434}, {4.906, 0.00354878}, {6.03816, 0.00730301}, {6.98162, 0.0127167}, {7.92508, 0.0212226}, {9.05723, 0.0342637}, {10.0007, 0.0462345}, {10.9442, 0.0586074}, {12.0763, 0.0760596}, {13.0198, 0.0933376}, {13.9632, 0.11305}, {14.9067, 0.137074}, {16.0388, 0.16735}, {16.9823, 0.192585}, {17.9258, 0.217247}, {19.0579, 0.248665}, {20.0014, 0.277623}, {20.9449, 0.305502}, {22.077, 0.339465}, {23.0205, 0.369906}, {23.9639, 0.401977}, {24.9074, 0.434157}, {26.0395, 0.477391}, {26.983, 0.511391}, {27.9265, 0.542689}, {29.0586, 0.579214}, {30.0021, 0.607107}, {30.9455, 0.639067}, {32.0777, 0.674537}, {33.0212, 0.709506}, {33.9646, 0.744078}, {34.9081, 0.777238}, {36.0402, 0.817115}, {36.9837, 0.85196}, {37.9272, 0.886969}, {39.0593, 0.937822}, {40.0028, 0.979181}, {40.9462, 1.01858}, {42.0784, 1.06353}, {43.0219, 1.09336}, {43.9653, 1.11857}, {44.9088, 1.14213}, {46.0409, 1.16449}, {46.9844, 1.18593}, {47.9279, 1.20096}, {49.06, 1.22164}, {50.0035, 1.23876}, {50.9469, 1.2508}, {52.0791, 1.27807}, {53.0226, 1.30499}, {53.966, 1.3368}, {54.9095, 1.36667}, {56.0416, 1.40522}, {56.9851, 1.43608}, {57.9286, 1.47795}, {59.0607, 1.54707}, {60.0042, 1.6163}}
$\endgroup$
5
  • 2
    $\begingroup$ please do list data $\endgroup$
    – elbOlita
    Commented Nov 15, 2015 at 19:37
  • $\begingroup$ @jj364, did you see this? $\endgroup$
    – garej
    Commented Nov 15, 2015 at 20:15
  • 1
    $\begingroup$ @garej, Seems like a duplicate to me. $\endgroup$
    – Michael E2
    Commented Nov 15, 2015 at 20:33
  • $\begingroup$ @Michael E2, No doubt, there are a lot of questions with Interpolation. $\endgroup$
    – garej
    Commented Nov 15, 2015 at 20:42
  • $\begingroup$ Also related: Marking points of intersection between two curves $\endgroup$
    – kglr
    Commented Dec 31, 2016 at 18:06

4 Answers 4

11
$\begingroup$

Using your data

plot1 = ListLinePlot[data, PlotStyle -> {Thick, Black}];
f = Function[t, a*t^n] /. FindFit[data, a*t^n, {a, n}, t, MaxIterations -> 1000]
plot2 = Plot[f[t], {t, 2, 60}, PlotStyle -> Red];

and then

Show[
 plot1,
 plot2,
 ImageSize -> 400
 ]

Mathematica graphics

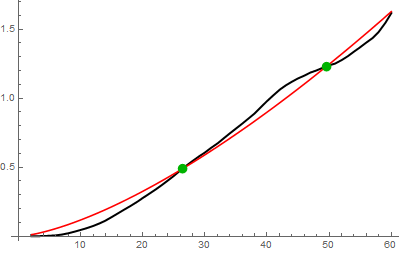
The same technique used here can be applied to this problem:

pts=Graphics`Mesh`FindIntersections@Show[
  plot1,
  plot2
  ]
(* {{26.3239, 0.487639}, {49.5794, 1.23106}} *)

So that

Show[
 plot1,
 plot2,
 Graphics[{
   RGBColor[0, 0.7, 0],
   PointSize -> 0.025,
   Point[pts]
   }],
 ImageSize -> 400
 ]

Mathematica graphics

$\endgroup$
1
  • $\begingroup$ Thank you very much, this solution works perfectly! $\endgroup$
    – jj364
    Commented Nov 16, 2015 at 17:09
3
$\begingroup$

A numerical approach

fit = a*t^n /. FindFit[data, a*t^n, {a, n}, t, MaxIterations -> 1000]

0.00407473 t^1.46296

Get fitted data

tab = Table[fit, {t, data[[1, 1]], data[[-1, 1]], (data[[-1, 1]] - data[[1, 1]])/(Length@data - 1)}];

Crossing positions

pos = Flatten@Position[Partition[Last /@ data - tab, 2, 1], {a_, b_} /; Sign@a != Sign@b];

Crossing at points

data[[pos]]

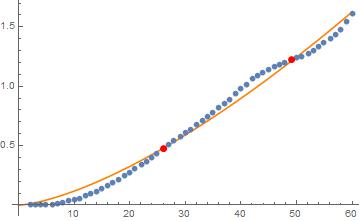
{{26.0395, 0.477391}, {49.06, 1.22164}}

Show[
 Plot[fit, {t, 0, 60}, PlotStyle -> Orange],
 ListPlot[data],
 Graphics[{Red, PointSize[0.02], Point@data[[pos]]}]]

enter image description here

$\endgroup$
3
$\begingroup$

To find exect numbers (using a picture), start with data from OP. enter image description here

Difine

f[t_] = a Power[t, n] /. 
  FindFit[data, a Power[t, n], {a, n}, t, MaxIterations -> 1000]

Then

g = Interpolation[data];
FindRoot[f[t] == g[t], {t, #}] & /@ {26, 50};
pts = Thread[{t /. s, f[t /. s]}]

{{26.2896, 0.486623}, {49.6013, 1.23181}}

You may also try without any picture

z = Quiet@FindRoot[f[t] == g[t], {t, #}] & /@ data[[All, 1]];
u = Sort@Select[DeleteDuplicates[Round[(t /. z), 0.001]], (# > 0) &]
pts4 = Thread[{u, f[u]}]

to get all four (!) points automatically

{{0.021, 0.0000143076}, {26.29, 0.486633}, {49.601, 1.2318}, {60.291, 1.63887}}

Show plots with points: enter image description here

$\endgroup$
2
$\begingroup$

When you draw Lines between data points, you actually imply a linear interpolation between the data points.

linint = Interpolation[data, InterpolationOrder -> 1];

Now you "only" have to calculate the roots of the function g to determine the intersection points between fit f and the linear interpolation of data.

g[t_] := f[t] - linint[t]

The roots can be calculated for example by employing the bisection method

bisection[f_, {a_?NumericQ, b_?NumericQ}, eps_?NumericQ] := 
 Module[{a1, b1, c1, Ya, Yb, Yc},
  a1 = a;
  b1 = b;
  c1 = (a1 + b1)/2.;
  Ya = f[a1];
  Yb = f[b1];
  If[Sign[Ya] === Sign[Yb],
   "no sign change",
   Yc = f[c1];
   While[Abs[a1 - b1] > eps,
    If[Sign[Yb] === Sign[Yc],
     b1 = c1; Yb = Yc,
     a1 = c1];
    c1 = (a1 + b1)/2.;
    Yc = f[c1]];
   {a1, b1}
   ]]

over intervalls

intervalle = Partition[Transpose[data][[1]], 2, 1];

Of course you can divide the intervals into smaller intervals to make sure to detect any root.

The result for intervalle gives:

NumberForm[
 Select[Map[bisection[g, #, 10.^-7] &, 
   intervalle], # =!= "no sign change" &], {12, 8}]

{{26.31398624,26.31398630},{49.58210184,49.58210189}}

These are the intervals where there is an intersection between the fit f and the linear interpolation of the data points.

$\endgroup$

Not the answer you're looking for? Browse other questions tagged or ask your own question.