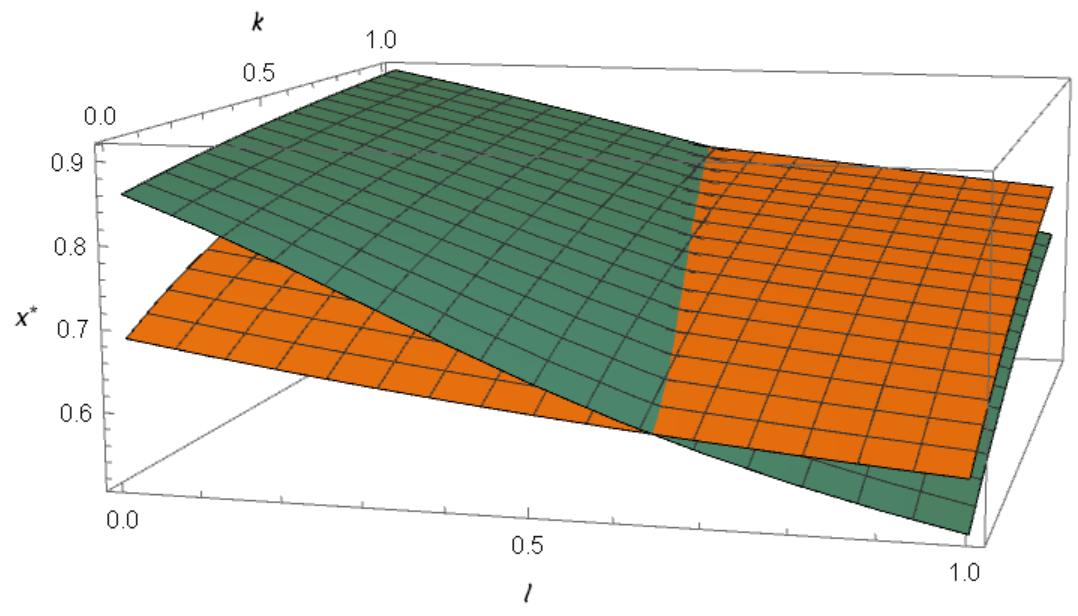
I would like to find the intersection points of two surfaces which are constructed with ListPlot3D. The first list is
x={{0.687522, 0.672048, 0.657758, 0.644584, 0.632436, 0.621219, 0.61084,
   0.601212, 0.592255, 0.583898, 0.57608}, {0.718239, 0.70296,
  0.688594, 0.675148, 0.662596, 0.650892, 0.639979, 0.629794,
  0.620276, 0.611365, 0.603006}, {0.744103, 0.729406, 0.71536,
  0.70202, 0.689407, 0.677517, 0.666327, 0.655806, 0.645912, 0.636603,
   0.627836}, {0.76593, 0.752001, 0.738512, 0.725536, 0.713119,
  0.701286, 0.690045, 0.679387, 0.669294, 0.65974,
  0.650698}, {0.784468, 0.771368, 0.75855, 0.746088, 0.734038,
  0.722443, 0.711325, 0.700697, 0.690559, 0.680901,
  0.671708}, {0.800344, 0.788064, 0.775953, 0.764077, 0.752495,
  0.741253, 0.730386, 0.719917, 0.709859, 0.700215,
  0.690982}, {0.814062, 0.802558, 0.791142, 0.779875, 0.768808,
  0.757989, 0.747455, 0.737236, 0.727353, 0.717818,
  0.708637}, {0.826019, 0.815231, 0.804478, 0.793809, 0.783271,
  0.772908, 0.762756, 0.752847, 0.743206, 0.733851,
  0.724796}, {0.836524, 0.826392, 0.816257, 0.806161, 0.796144,
  0.786244, 0.776496, 0.766933, 0.757579, 0.748456,
  0.73958}, {0.845825, 0.836288, 0.826724, 0.817166, 0.807648,
  0.798205, 0.788868, 0.779666, 0.770625, 0.761767,
  0.75311}, {0.854114, 0.845118, 0.836077, 0.82702, 0.817975,
  0.808973, 0.80004, 0.791203, 0.782487, 0.773913, 0.765501}}
The second list is :
y={{0.86018, 0.823767, 0.783404, 0.740538, 0.697531, 0.656804, 0.619925,
   0.58739, 0.558988, 0.534209, 0.512495}, {0.868675, 0.835506,
  0.798953, 0.760038, 0.720471, 0.682171, 0.646621, 0.61455, 0.586049,
   0.560854, 0.538561}, {0.876074, 0.845573, 0.812132, 0.776497,
  0.739939, 0.703976, 0.66993, 0.638615, 0.610325, 0.584988,
  0.562348}, {0.882593, 0.854335, 0.82349, 0.79062, 0.756691, 0.72291,
   0.690421, 0.660043, 0.632184, 0.606922, 0.584127}, {0.888395,
  0.862052, 0.83341, 0.802903, 0.771278, 0.739504, 0.708556, 0.679212,
   0.65194, 0.62692, 0.604125}, {0.893601, 0.868915, 0.842169,
  0.813704, 0.78411, 0.754168, 0.724707, 0.69644, 0.669857, 0.645204,
  0.622538}, {0.898304, 0.875068, 0.849974, 0.823293, 0.795497,
  0.767223, 0.739173, 0.711991, 0.68616, 0.661967,
  0.63953}, {0.902579, 0.880625, 0.856984, 0.831874, 0.805679,
  0.778923, 0.752202, 0.726087, 0.701042, 0.677375,
  0.655245}, {0.906485, 0.885673, 0.86332, 0.839607, 0.814846,
  0.789472, 0.763993, 0.738914, 0.714668, 0.691571,
  0.66981}, {0.91007, 0.890283, 0.869082, 0.846617, 0.823147,
  0.799035, 0.774713, 0.750629, 0.727182, 0.704681,
  0.683333}, {0.913376, 0.894513, 0.874348, 0.853006, 0.830703,
  0.807745, 0.784502, 0.761367, 0.738705, 0.716816, 0.695914}}
I join them with Join[{x}, {y}] and the ListPlot3D looks like:
I would like to find the intersection points of those two surfaces.


xandy, then there are no points common for both:ContainsAny[Catenate@x, Catenate@y]yieldsFalse. I guess you'd want anInterpolationof the surfaces and their (numerical) intersection. But please explain in what form do you want it: a list of 3D points, a function that gives such point given one of the coordinates, anInterpolatingFunctiondescribing the curve in 3D, an analytical approximation? $\endgroup$In[383]:= fullx = Flatten[MapIndexed[Flatten[{#2, #1}] &, x, {2}], 1]; fully = Flatten[MapIndexed[Flatten[{#2, #1}] &, y, {2}], 1]; nfx = Nearest[fullx]; nbrs = Map[{#, First[nfx[#]]} &, fully]; close = Select[nbrs, Norm[#[[1]] - #[[2]]] < 1/100 &][[All, 1]] Out[387]= {{1, 7, 0.619925}, {2, 7, 0.646621}, {3, 7, 0.66993}, {4, 7, 0.690421}, {5, 7, 0.708556}, {6, 7, 0.724707}, {7, 6, 0.767223}, {7, 7, 0.739173}, {8, 6, 0.778923}, {9, 6, 0.789472}, {10, 6, 0.799035}, {11, 6, 0.807745}}$\endgroup$ListPlot3D[Join[{x}, {y}], Axes -> True]gives the range{1, 11}; your plot is inconsistent with your description. $\endgroup$