0
$\begingroup$

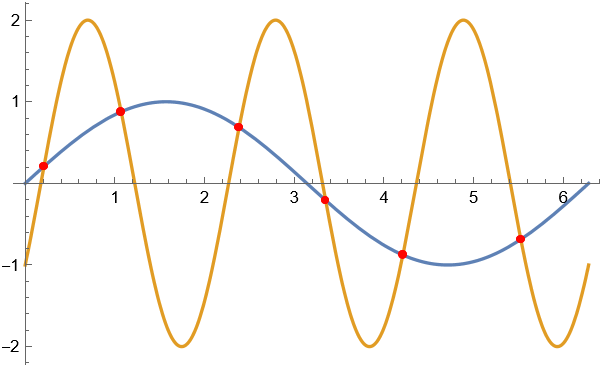
To identify all the intersection points between the two function graphsy=sinxand y=2sin(3x-Pi/6) within the domain 0<=x<=2Pi, my method is to solve the equation Sin[x] == 2 Sin[3 x - \[Pi]/6] for all roots in this domain, and then use the Table function to label all intersection points and their coordinate values on the graph.

This method is feasible, but are there any better methods? Code that is more concise and efficient?

My code is as follows:

expr = {Sin[x], 2 Sin[3 x - \[Pi]/6]}
intersectionConditions = 
 Solve[{Sin[x] == 2 Sin[3 x - \[Pi]/6], 0 <= x <= 2 \[Pi]}, x, 
   Reals] // FullSimplify
intersectionValues = 
  If[intersectionConditions != {}, 
   Table[{x, Sin[x]} /. intersectionConditions[[i]] // 
     FullSimplify, {i, 1, Length[intersectionConditions]}], 
   "intersection Does Not Exist"];
If[intersectionConditions != {}, {Table[{x, Sin[x]} /. 
      intersectionConditions[[i]] // FullSimplify // N, {i, 1, 
    Length[intersectionConditions]}]}]
Plot[expr, {x, 0, 2 \[Pi]}, PlotRange -> {{0, 2.5 \[Pi]}, Automatic}, 
 AxesOrigin -> {0, 0}, Axes -> True, ImageSize -> 600, Epilog -> {
   If[intersectionConditions != {}, {PointSize[Medium], Red, 
     Point[intersectionValues], Style[FontSize -> Tiny], 
     Table[Text[intersectionValues[[p]] // N, 
       Offset[{-10, -18}, intersectionValues[[p]]]], {p, 1, 
       Length[intersectionValues], 1}]}]}]

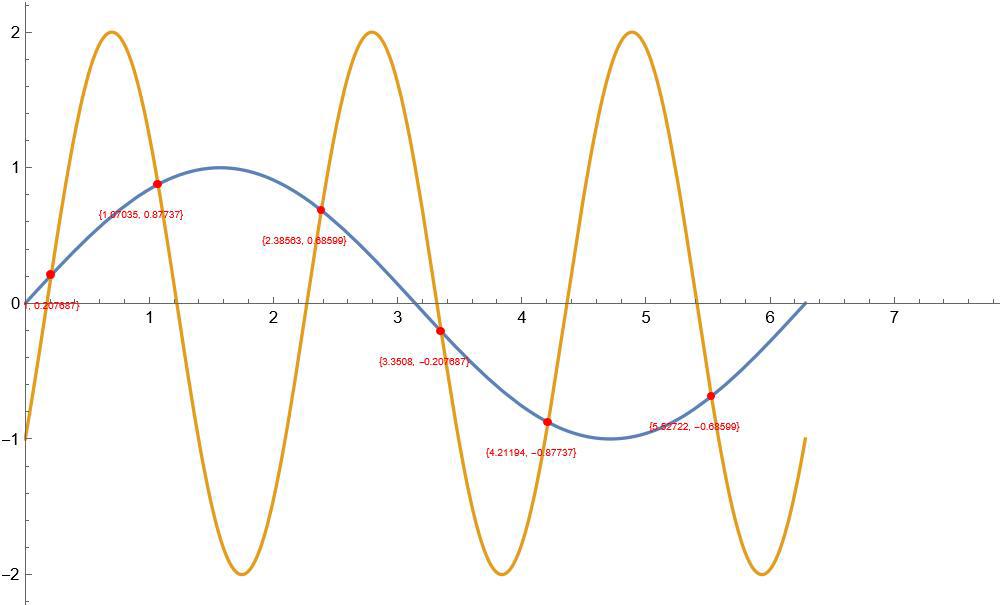
The effect achieved is as follows:

enter image description here

$\endgroup$
1

3 Answers 3

2
$\begingroup$

One simple way would be to use the resource functions CurveIntersection and IntersectionPlot by Wolfram|Alpha Math Team

fun = {Sin[x], 2 Sin[3 x - Pi/6]}

cin = ResourceFunction["CurveIntersection"];

p = cin[fun, x, Reals, "Constraints" -> 0 <= x <= 2 Pi] // N // Values

{{0.20921, 0.207687}, {1.07035, 0.87737}, {2.38563, 0.68599},
{3.3508, -0.207687}, {4.21194, -0.87737}, {5.52722, -0.68599}}

pin = ResourceFunction["IntersectionPlot"];

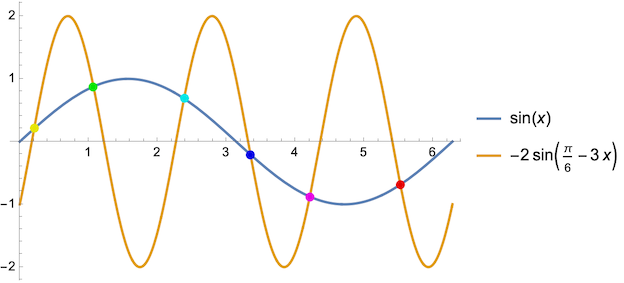
plot = pin[fun, {x, 0, 2 Pi}]

enter image description here

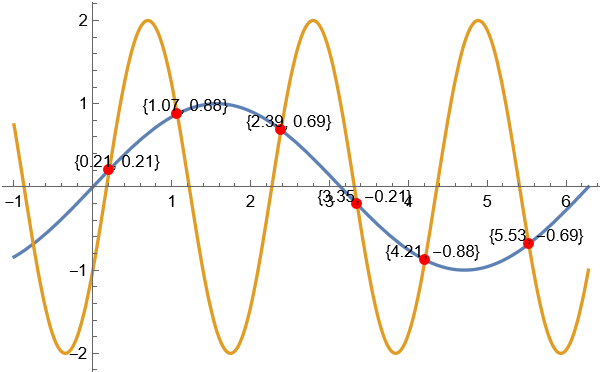
Mouse pointing at the intersection points we can see their coordinates. Alternatively we could do:

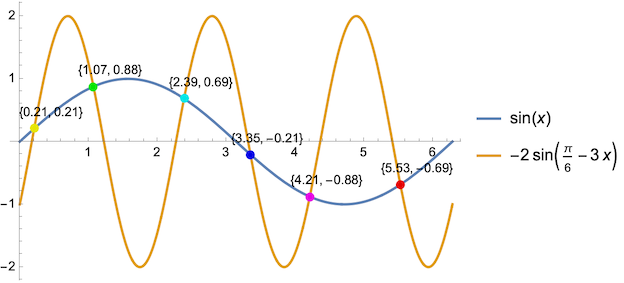
text = Table[Text[Round[p[[i]], 0.01], p[[i]] + {0.25, 0.25}], {i, Length[p]}]

Show[plot, Graphics @ text]

enter image description here

$\endgroup$
0
$\begingroup$

I wrote one based on the content provided by the URL given by xzczd.


Clear["`*"]
expr = {Sin[x], 2  Sin[3  x - \[Pi]/6]};
points = 
 SolveValues[{Sin[x] == 2  Sin[3  x - \[Pi]/6], 0 <= x <= 2  \[Pi]}, 
    x] // N // Sort
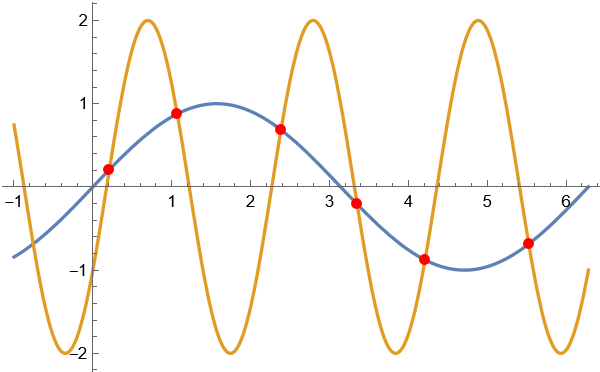
plot = Plot[expr, {x, -1, 2  \[Pi]}, Mesh -> {points}, 
   MeshStyle -> {Directive[Red, PointSize[Large]]}, 
   Exclusions -> Range[-5  \[Pi]/2, 5  \[Pi]/2, \[Pi]]];
labels = 
  Table[Text[Round[{points[[i]], Sin[points[[i]]]}, 0.01], 
    Offset[{10, 10}, {points[[i]], Sin[points[[i]]]}], {1, 0}], {i, 
    Length[points]}];
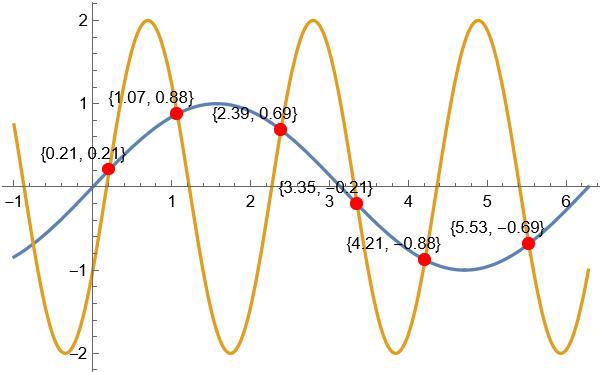
Show[plot, Epilog -> labels]

enter image description here


Plot[{Sin[x], 2  Sin[3  x - \[Pi]/6]}, {x, 0, 2  Pi}, 
 MeshFunctions -> {(Sin[#] - 2  Sin[3  # - \[Pi]/6]) &}, 
 Mesh -> {{0}}, MeshStyle -> Directive[Red, PointSize[Medium]]]

enter image description here


Clear["`*"]
expr = {Sin[x], 2  Sin[3  x - \[Pi]/6]};
sol = SolveValues[{Sin[x] == 2  Sin[3  x - \[Pi]/6], 
     0 <= x <= 2  \[Pi]}, x] // N // Sort
plot = Plot[expr, {x, -1, 2  \[Pi]}, 
  Epilog -> {Red, PointSize[0.017], Point[{#, Sin[#]} & /@ sol]}]

enter image description here

$\endgroup$
0
$\begingroup$

Clear["`*"]
expr = {Sin[x], 2  Sin[3  x - \[Pi]/6]};
sol = SolveValues[{Sin[x] == 2  Sin[3  x - \[Pi]/6], 
      0 <= x <= 2  \[Pi]}, x] // N // Sort;
Plot[expr, {x, -1, 2  \[Pi]}, 
 Epilog -> {Red, PointSize[0.017], Point[{#, Sin[#]} & /@ sol], Black,
    Table[Text[
     Round[{#, Sin[#]} &@sol[[i]], 
      0.01], {#, Sin[#]} &@sol[[i]] + {0.1, 0.1}], {i, 
     Length[sol]}]}]

enter image description here

$\endgroup$

Not the answer you're looking for? Browse other questions tagged or ask your own question.